
Figure 2.
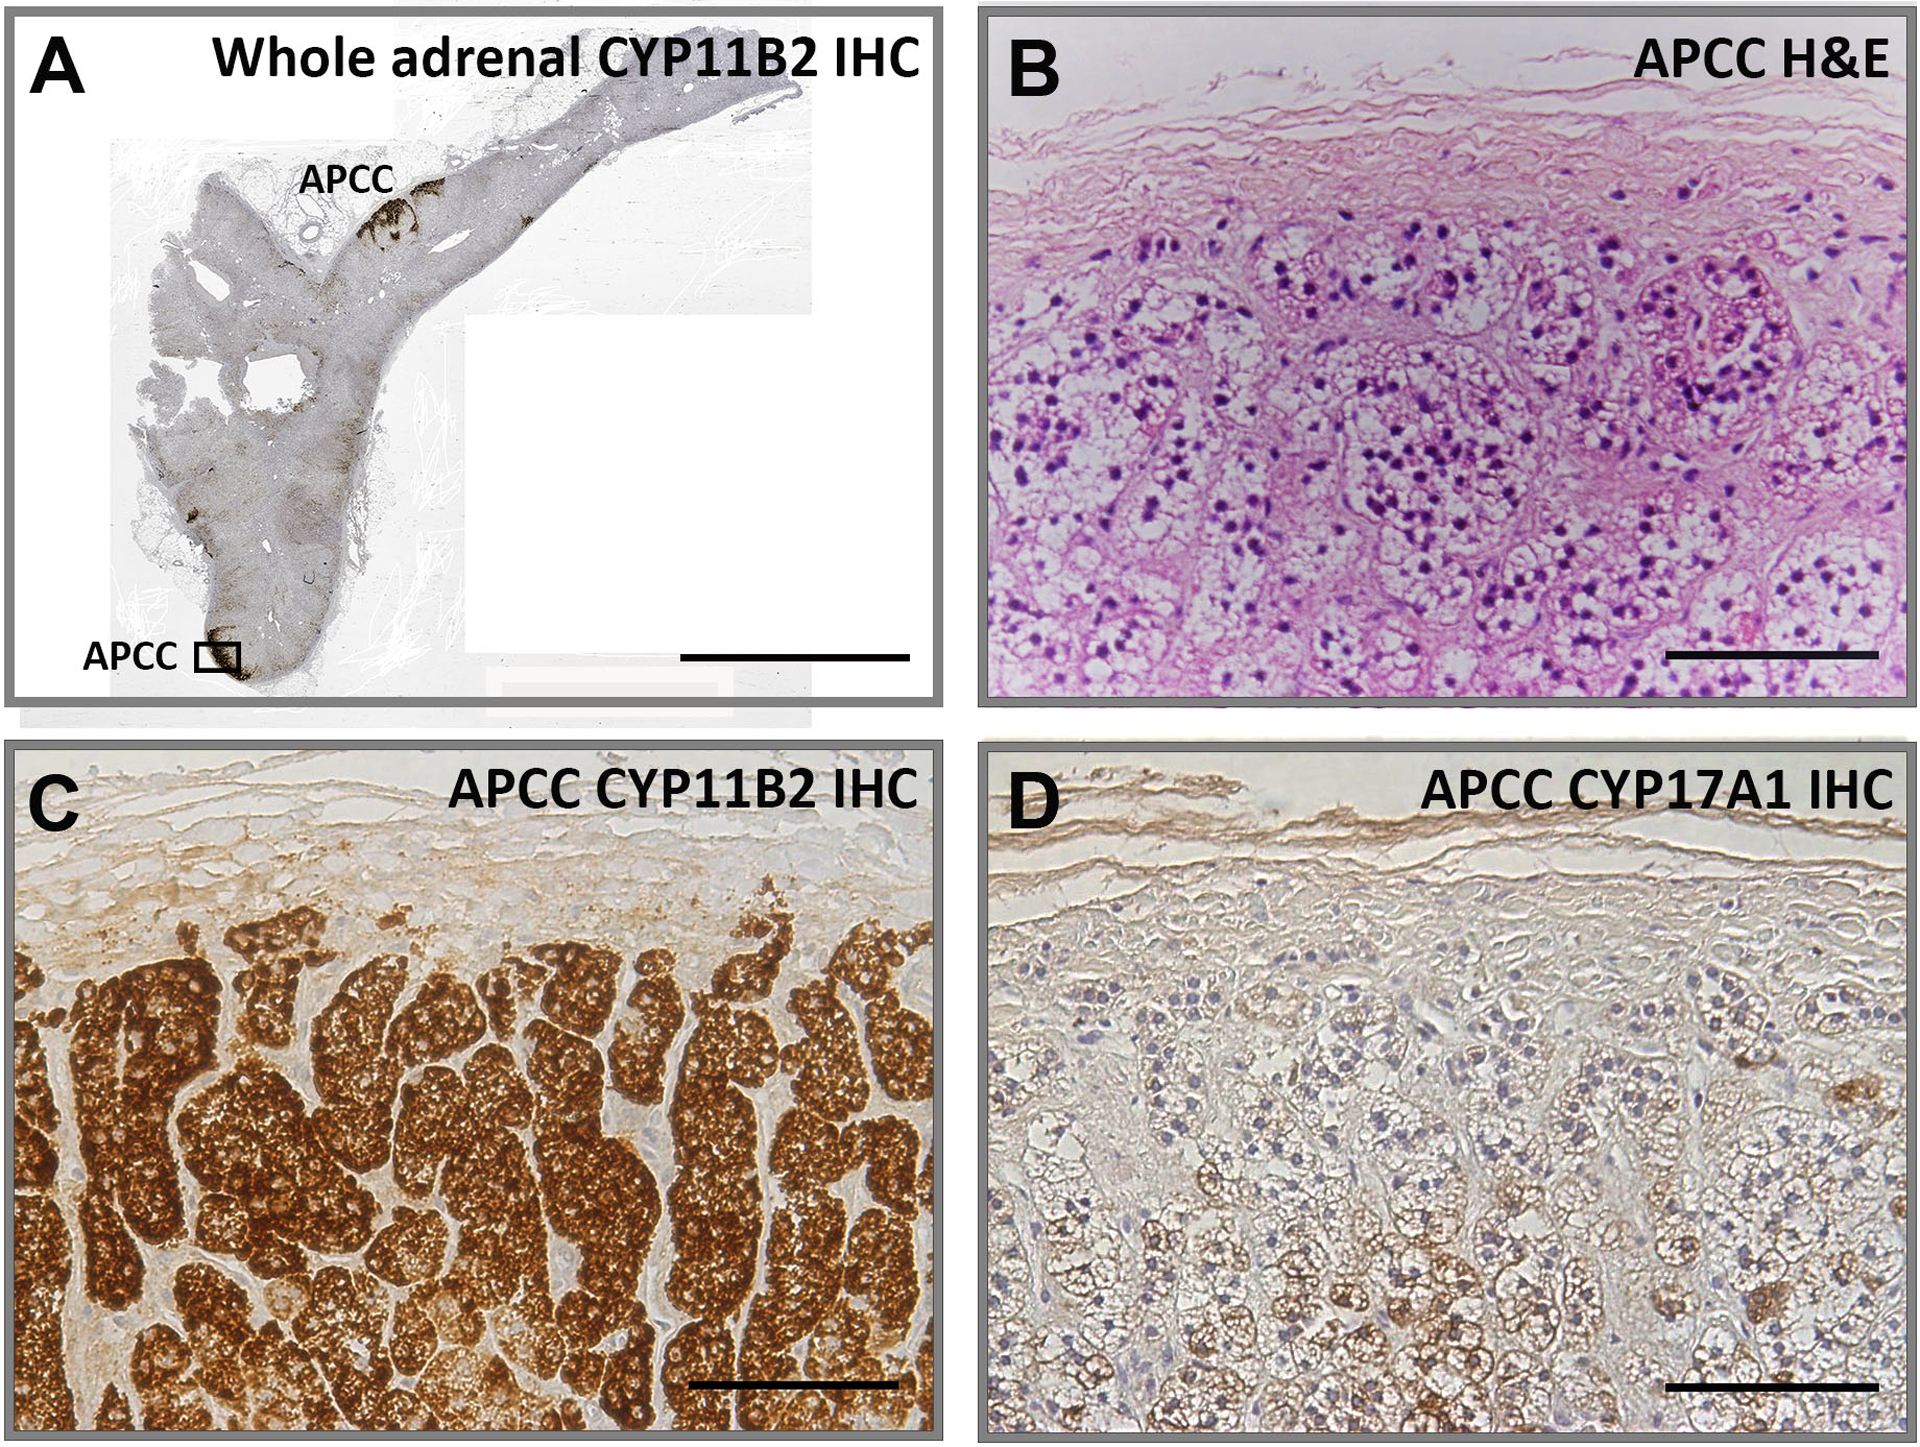
Visualization of representative adrenal with aldosterone-producing cell clusters (APCC) with immunohistochemistry. Panel A shows a whole adrenal with multiple APCC visualized following CYP11B2 IHC. The APCC indicated by the black box is the focus of Panels B, C and D. Panel B. Hematoxylin and eosin (H&E) staining, Panel C. CYP11B2 IHC. Panel D. CYP17A1 IHC. Panel A bar indicates 5 mm. Panel B, C and D bars indicate 100 μm.