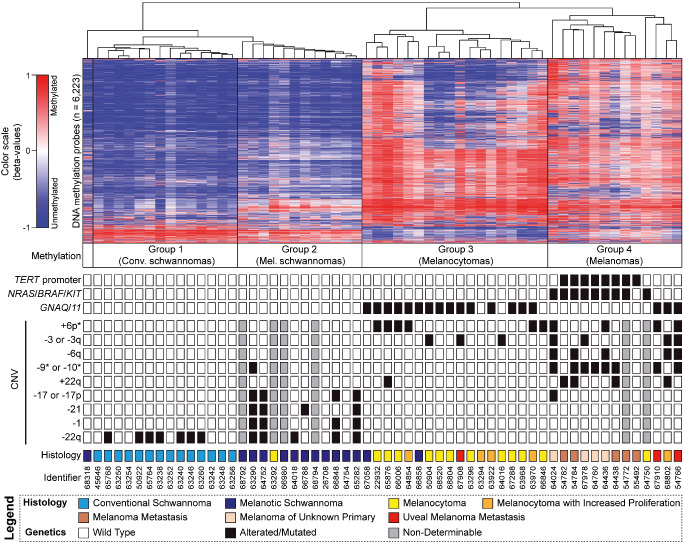
Figure 1.

Molecular profiling of melanotic nervous system tumors. Heatmap depicting unsupervised hierarchical clustering of methylation levels of the top 6223 most variant probes (SD >0.25) in melanotic tumors of the nervous system. Each row represents a probe; each column represents a sample. The level of DNA methylation (beta value) is represented with a color scale as depicted. Conventional schwannomas served as control group. For each sample (n = 58), associated methylation group, results of oncogene sequencing, selected chromosomal copy number variants (CNVs) and histological diagnosis are indicated. * = partial losses included.
