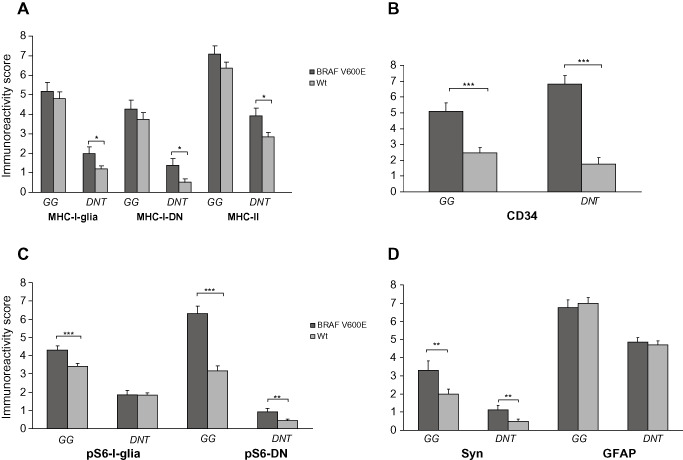
Figure 6.

MHC‐I, MHC‐II, CD34, pS6, synaptophysin and glial fibrillary acidic protein (GFAP) immunoreactivity score (IRS) in BRAF wild‐type or BRAF‐mutated gangliogliomas (GGs) and dysembryoplastic neuroepithelial tumor (DNTs) . A. MHC‐I (glial/neuronal) and MHC‐II IR scores (total score; mean ± SEM) in BRAF wild‐type (Wt) or BRAF‐mutated (BRAF V600E) GGs and DNTs. B. CD34 IR scores (total score; mean ± SEM) in BRAF wild‐type (Wt) or BRAF‐mutated (BRAF V600E) GGs and DNTs. C. pS6 (glial/neuronal) IR scores (total score; mean ± SEM) in BRAF wild‐type (Wt) or BRAF‐mutated (BRAF V600E) GGs and DNTs. D. Synaptophysin (Syn) and GFAP IR scores (total score; mean ± SEM) in BRAF wild‐type (Wt) or BRAF‐mutated (BRAF V600E) GGs and DNTs. Syn = synaptophysin; DN = dysplastic neuron; *P < 0.05; **P < 0.01; ***P < 0.001.
