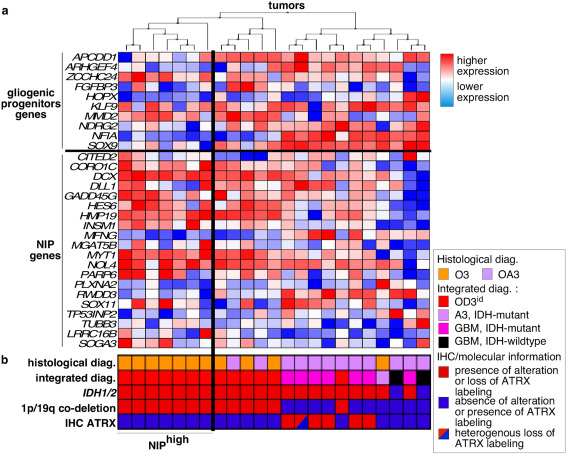
Figure 2.

Hierarchical clustering of tumors according to the expression of genes of the gliogenic progenitor vs. NIP. a. columns correspond to tumors and lines correspond to genes. NIPhigh subgroup contained 1p/19q co‐deleted AOT clustering together with higher expression of NIP genes. NIPlow subgroup contained the other 1p/19q co‐deleted AOT. b. WHO 2016 histological and integrated diagnoses and molecular markers are indicated for each tumor. Abbreviations: A3, IDH‐mutant: anaplastic astrocytoma, IDH‐mutant; GBM, IDH‐mutant: glioblastoma, IDH‐mutant; GBM, IDH‐wildtype, glioblastoma, IDH‐wildtype; IHC, immunohistochemical; OA3, anaplastic oligo‐astrocytoma; OD3, anaplastic oligodendroglioma.
