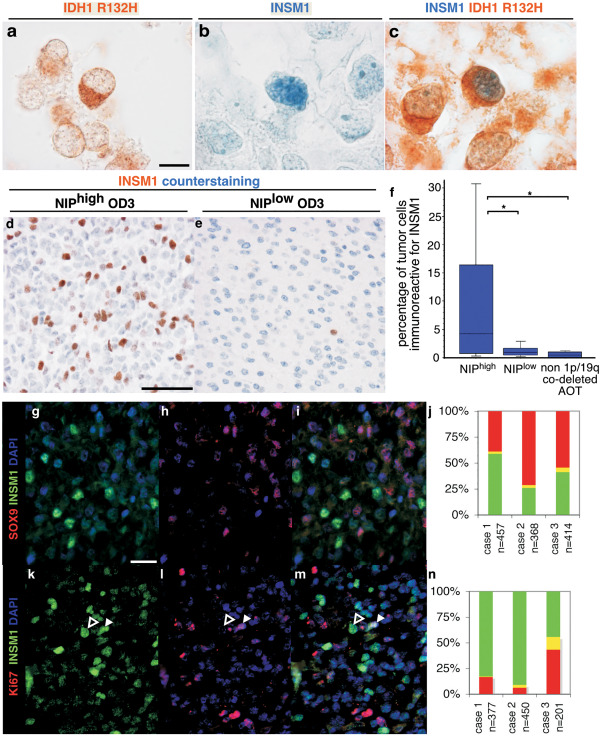
Figure 3.

INSM1 immunolabeling in anaplastic oligodendroglial tumors. a–c. three sections of the same anaplastic oligodendroglial tumor of the NIPhigh subgroup were immunolabeled for IDH1 R132H (brown signal in a, c), and INSM1 (blue signal in b, c). Some tumor cells showed cytoplasmic immunolabeling for IDH1 R132H and nuclear immunolabeling for INSM1 (c). d, e. Immunolabeling of INSM1 (brown signal) and counterstaining (blue signal) in anaplastic oligodendroglioma of the NIPhigh and NIPlow subgroups. f. Quantification of INSM1 immunolabeling in NIPhigh vs. NIPlow and non 1p/19q co‐deleted tumors with significant difference (P = 0.0163 Kruskal–Wallis test; asterisk NIPhigh vs. NIPlow P = 0.0454; asterisk NIPhigh vs. non 1p/19q co‐deleted AOT P = 0.0143; Mann–Whitney test). g–i. Double immunolabeling of an anaplastic oligodendroglial tumors of the NIPhigh subgroup by INSM1 (green, g, i) and SOX9 (red, h, i) with quantification (j). Both markers are expressed by two mainly exclusive tumor cell populations. k–m, double immunolabeling of an anaplastic oligodendroglial tumors of the NIPhigh subgroup by INSM1 (green, k, m) and Ki‐67 (red, l, m) with quantification (n). Most INSM1+ cells are negative for Ki‐67 (open arrowhead, f–h) and a minority of INSM1+ cells are positive for Ki‐67 (solid arrowhead, f–h). Scale bars. A–C: 10 µm, D–E: 50 µm. G–I, K–M: 20 µm.
