
Figure 2.
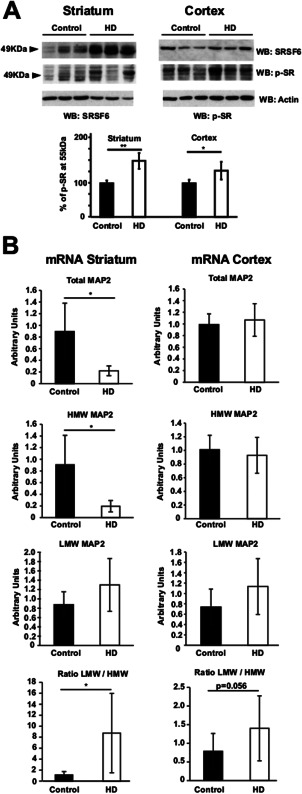
MAP2 splicing is altered in the striatum of HD patients. A. Western‐blot analysis of SRSF6 and p‐SR in controls and HD patients (striatum in left panels, n = 3/7 and cortex in right panels n = 5/6). Graph represents the quantification of p‐SR western‐blots at 55kDa (SRSF6). Student's t‐test, * P < 0.05, **P < 0.01. B. Graphs show relative RT‐qPCRs performed to detect (from above) Total MAP2, HMW MAP2 and LMW MAP2 in controls and HD patients. Last graph below correspond to the ratio LMW/HMW. Striatum in left panels n = 5/7. Cortex in right panels n = 6/7. Mann‐Whitney U‐test,* P < 0.05.