
Figure 3.
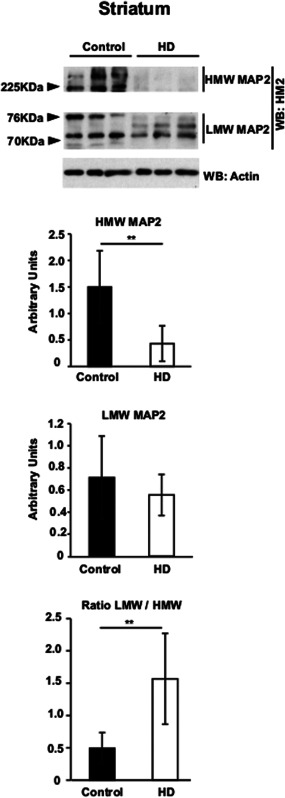
MAP2 isoforms are disbalanced at the protein level in the striatum of HD patients. Western‐blot analysis of MAP2 isoforms in striatum of Controls and HD patients. Graphs represent the quantification of western‐blots. Last graph below correspond to the ratio LMW/HMW. n = 7/8. Student's t‐test, ** P < 0.01.