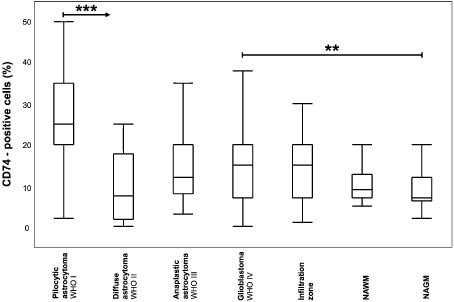
Figure 4.

CD74 expression is differentially regulated in astrocytic tumors and normal central nervous system (CNS) tissues. Box and Whisker plots for CD74‐positive cells (in %) in astrocytomas I–IV, GBM infiltration zones as well as normal‐appearing CNS tissues are depicted. The relative amount of CD74‐positive cells in pilocytic astrocytoma, World Health Organization (WHO) grade I (n = 47); diffuse astrocytoma WHO grade II (n = 16); anaplastic astrocytoma WHO grade III (n = 35); glioblastoma WHO grade IV (n = 252), GBM infiltration zone (n = 37), normal‐appearing white matter of GBM samples (NAWM; n = 16) as well as normal‐appearing grey matter of GBM samples (NAGM; n = 44) was statistically assessed using the nonparametric Wilcoxon's test. A significance level of alpha = 0.05 was chosen for all testings. For adjustment of the P‐values because of multiple testing we used the method of Bonferroni–Holm. Statistical analysis was performed using JMP 8.0.1 software (SAS).
