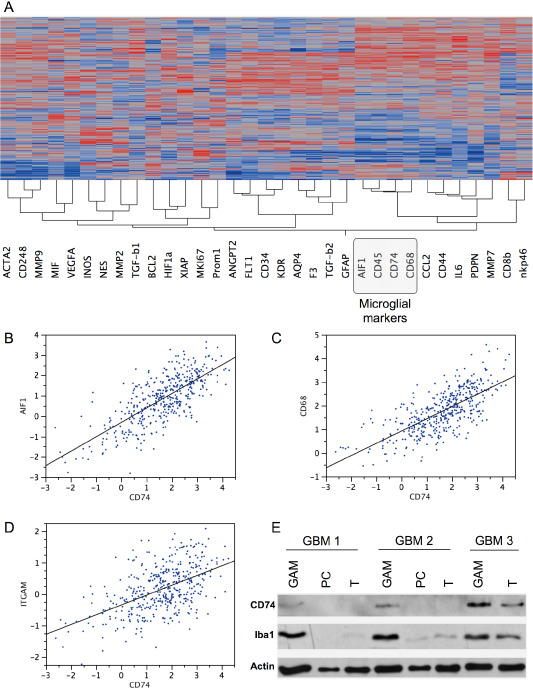
Figure 6.

CD74 mRNA and protein levels correlate with the content of glioma‐associated microglia/macrophages (GAMs). Hierarchical cluster analyses (A) of gene expression signatures of selected key factors of immune cells, glioblastoma cells as well as glioblastoma micromilieu of 424 primary glioblastomas and 11 normal brain samples deriving from the cancer genome atlas (TCGA) data portal using the Agilent 244K G4502A microarray to determine mRNA profiles. Hierarchical clustering of this data was performed using the Ward's minimum variance method. Dark red color indicates a perfect positive correlation (+1) gradually decreasing to a perfect negative correlation (−1) indicated in blue. Correlation analyses of the same data subset comparing CD74 with either (B) Iba1 (AIF1), (C) CD68 or (D) CD11b (ITGAM) are depicted. CD74 and Iba1 immunoblotting (E) of GAMs, glioblastoma cells (PC) and whole glioblastoma tissue (T) of three different patients with primary glioblastoma World Health Organization (WHO) grade IV showing a positive correlation of CD74 and Iba1 protein expression. Actin served as positive control.
