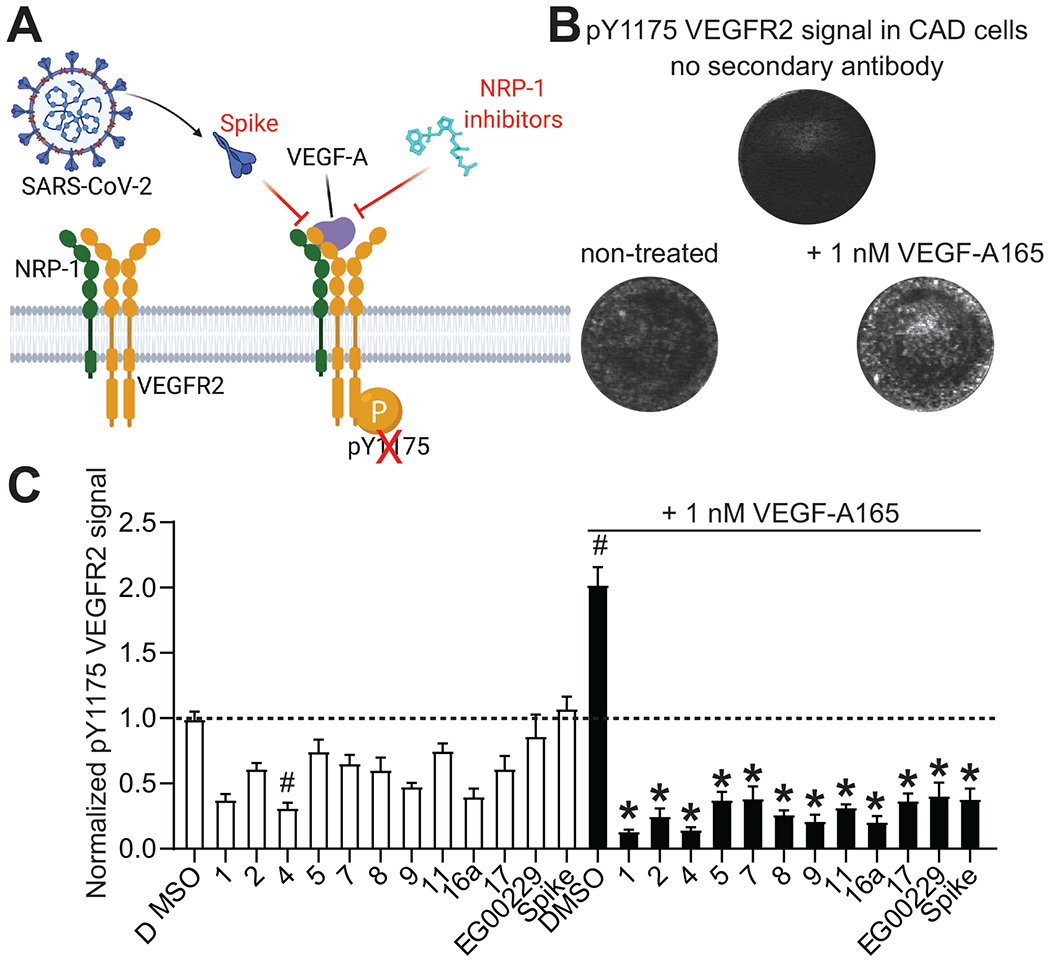
Figure 7. Screening of NRP-1/VEGF-A165 inhibitors by in cell western.

A. Schematic of VEGF-A triggered phosphorylation of VEGF-R2. B. Representative micrographs of Cathecholamine A differentiated (CAD) cells showing the lack of signal in controls with omission of the secondary antibody. Phosphorylated VEGFR2 was increased by the addition of 1 nM VEGF-A165 on the cells. Cells were stained for pY1175 VEGFR2 as a marker of the activation of the pathway by VEGF-A165 (see Methods). C. Bar graph showing the levels of pY1175 VEGFR2 normalized to the quantity of cells in each well. Cells were treated with the NRP-1/VEGF-A165 inhibitors at 12.5 μM or SARS-CoV-2 Spike (100 nM) in combination with 1 nM VEGF-A165 as indicated. # p<0.05 compared to 0.1% DMSO (vehicle) treated cells without VEGF-A165. * p<0.05 compared to 0.1% DMSO + 1 nM VEGF-A165 treated cells, Kruskal-Wallis test with Dunn’s multiple test correction (n=7 replicates per condition). Data was analyzed by a repeated measures one-way analysis of variance (post hoc: Dunnett’s), *p<0.05.
