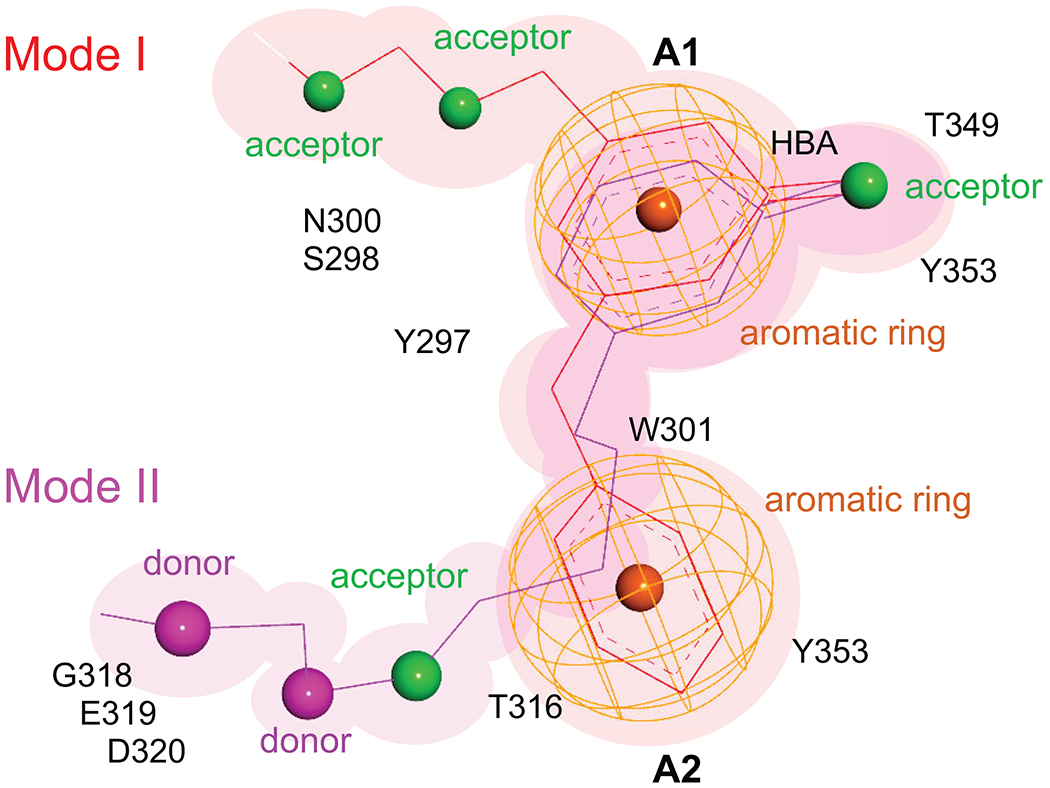
Figure 9. Schematic of pharmacophore models.

Thin lines indicate bond distances between pharmacophores while the color indicates the mode of binding (Mode I in red, Mode II in magenta). Pharmacophore features are shown in color (acceptors in green, donors in magenta, and aromatic rings as orange mesh). The neighboring or contact protein residues are listed.
