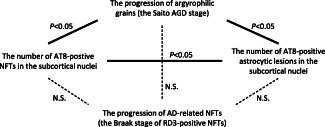
Figure 7.

Statistical analyses of the relationship between four histological factors, the AGD stage, AT8‐positivie NFTs in the subcortical nuclei, AT8‐positive astrocytic lesions in the subcortical nuclei and Braak stage of RD3‐positive NFTs, in the combined group of AGD and AGD‐TA. The data regarding the quantity of NFTs and AT8‐positive astrocytic lesions in the caudate nucleus, putamen, globus pallidus, subthalamic nucleus and substantia nigra were used in this correlation study. Solid lines represent statistically significant correlation (P < 0.05). N.S. = not significant. See details in the text.
