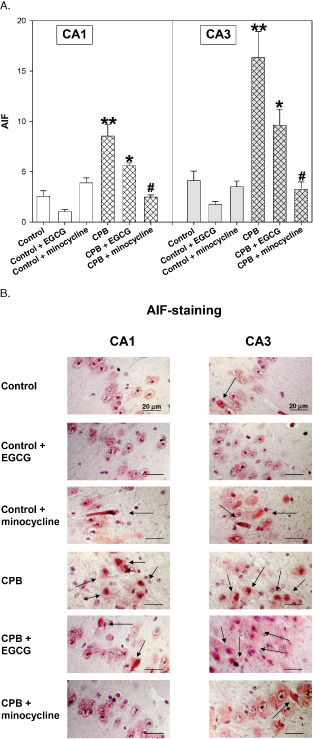
Figure 4.

A. Apoptosis‐inducing factor (AIF)‐staining of hippocampus CA1 and CA3 regions of control piglets without or with epigallocatechin‐3‐gallate (EGCG) or minocycline and piglets after cardiopulmonary bypass (CPB) without or with EGCG or minocycline, respectively. Bar graphs depict the number of positive cell nuclei (in %). All values of are given as means ± standard error of the mean (SEM). Significant differences to control are indicated by asterisks * (P < 0.05), ** (P < 0.01); significant differences to CPB by a hash # (P < 0.05). B. Original image showing AIF‐staining of hippocampus CA1 and CA3 regions. Arrows indicate cell nuclei positive for AIF (stained in red).
