
Figure 3.
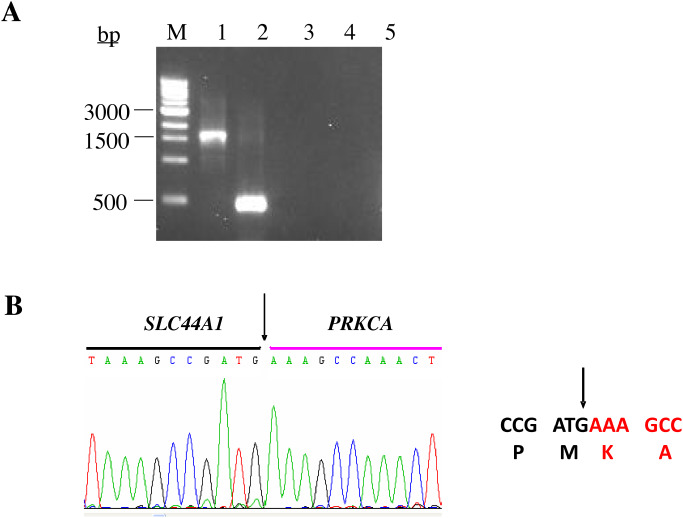
Ethidium‐bromide agarose gel electrophoresis of the reverse‐transcription polymerase chain reaction (RT–PCR) products. (A) Lane M represents the 1.0‐kb DNA molecular weight marker ladder. Lanes 1 and 2 demonstrate the SLC44A1‐PRKCA fusion transcripts as detected in cases 1 (1655 bp) and 2 (495 bp), respectively. Lanes 3, 4 and 5 represent negative controls; clear cell sarcoma cell line SU‐CCS‐1, no reverse transcriptase, and no template, respectively. (B) Sequence alignment of the SLC44A1‐PRKCA breakpoint region. Arrows depict the fusion point. Single letter amino acid code is displayed beneath the nucleotide sequence.