
Figure 4.
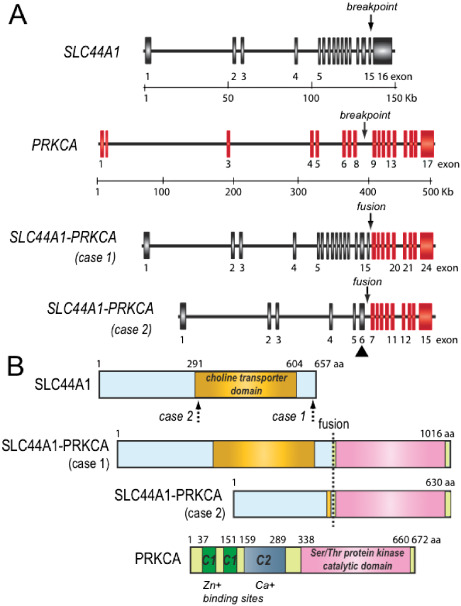
Schematic diagrams of SLC44A1, PRKCA, and cases 1 and 2 SLC44A1‐PRKCA fusion genes (A) and predicted fusion proteins (B), respectively. The solid triangle indicates the in‐frame deletion and fusion between exons 6 and 14 of SLC44A1 for case 2. The dotted arrows show the two different breakpoints in SLC44A1 protein.