
Figure 1.
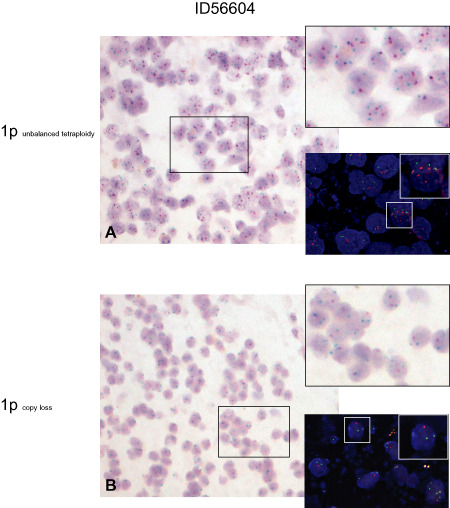
Chromogenic in situ hybridization (CISH) and repeated fluorescence in situ hybridization (FISH) analysis in tumor ID56604 (OIII). Upper panel: overview of a tumor area suggestive for an unbalanced tetraploidy by CISH analysis (A), magnification ×200. Insets to the right: CISH analysis (upper panel) and FISH analysis (lower panel) identify a high number of tumor cells harboring three signals for the target probe 1p36 (red in both FISH and CISH) and three to four signals for the control probe 1q25 (green in both FISH and CISH). Magnification ×400, inset in FISH analysis ×1000. Lower panel: overview of a CISH‐identified tumor area with clear evidence of 1p loss (B), magnification ×200. Insets to the right: CISH analysis (upper panel) and FISH analysis (lower panel) in the CISH‐preselected tumor area confirm 1p loss in the majority of tumor cells. Tumor cells show two signals for reference probe 1q25 and one signal for the target probe 1p36 in both the FISH and CISH analysis. Magnification ×400, inset in FISH analysis ×1000.