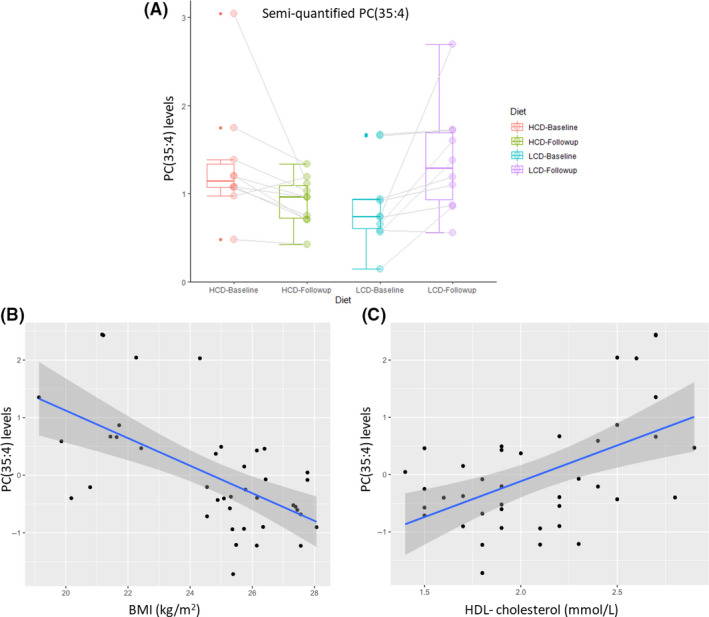
Figure 1.

Jittered box plots of pre‐post lipid levels comparisons of PC(35:4) in each diet intervention and association with BMI and HDL cholesterol. PC(35:4): (β ± SE: 1.04 ± 0.28, p = .043) was elevated during LCD (a) and inversely associated with BMI (b) and positively associated with HDL cholesterol (c). HB: High carbohydrate diet at baseline, HF: High carbohydrate diet at follow‐up, LB: Low carbohydrate diet at baseline, LF: Low carbohydrate diet at follow‐up
