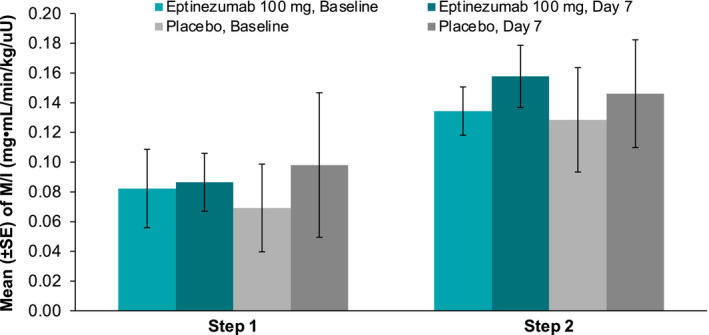
FIGURE 1.

Mean M/I ratio at baseline and day 7 for eptinezumab and placebo. Step 1: Insulin was infused at a rate of 10 mU/m2/min for 180 min. This level of insulin infusion raised the plasma insulin concentration to a level suitable for assessing sub‐maximal suppression of endogenous glucose production (EGP). Step 2: Insulin was infused at a rate of 40 mU/m2/min for 180 min (beginning at the end of Step 1). This level of insulin infusion was sufficient to provide near‐maximal glucose disposal and EGP suppression. Abbreviations: M/I, weight‐corrected glucose infusion rate (GIR) divided by the plasma insulin concentration at steady state
