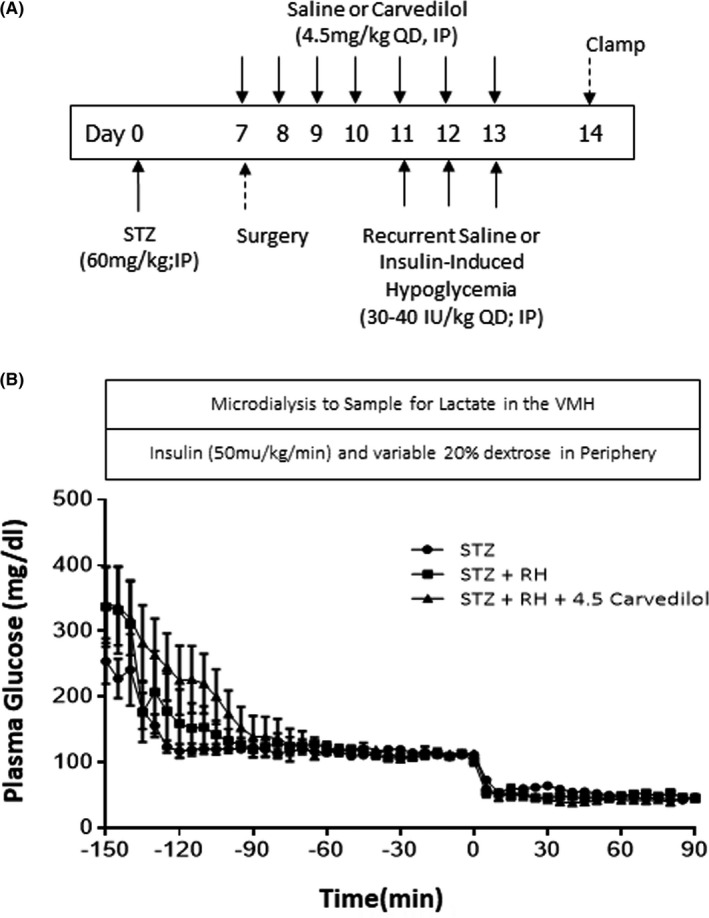
FIGURE 1.

A, Hypoglycaemic Clamp Study Design. Schematic outlining the treatment time course. Diabetes was induced on day 0. Surgery for the implantation of catheters and microdialysis guide cannulas was performed one week later. Saline or carvedilol treatments were administered daily starting on day 7 and continued until day 13. Recurrent saline or insulin treatments was conducted from day 11–13. The hypoglycaemic clamp was conducted on Day 14. B, Plasma glucose concentrations throughout the clamp procedure. STZ Controls are represented as circles. STZ +recurrently hypoglycaemic diabetic (RH) animals are shown as squares, the RH diabetic rats treated with 4.5 mg/kg carvedilol (STZ+RH+4.5 Carvedilol) are shown as solid triangles. The hypoglycaemic phase of the study was from 0’ to 90’
