
FIGURE 4.
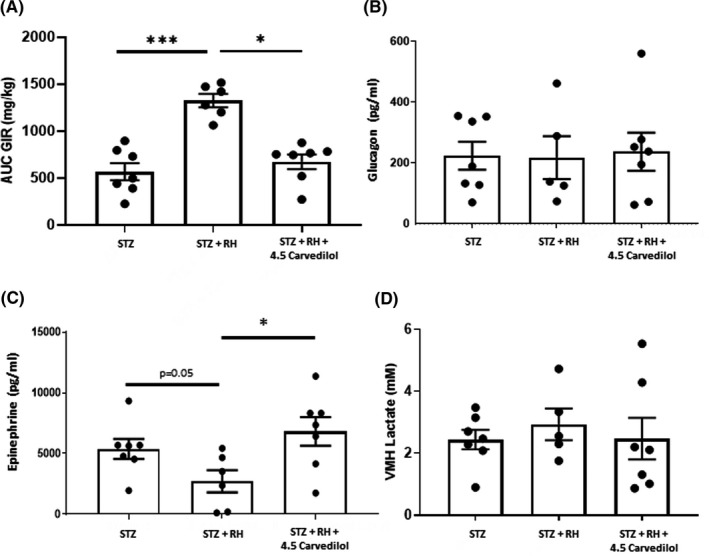
A, Total glucose infused over the final 30 min of the hypoglycaemic clamp procedure. B, Peak plasma glucagon and C, peak epinephrine responses during the hypoglycaemic phase of the clamp; and D, baseline extracellular lactate concentrations in the ventromedial hypothalamus of diabetic (STZ), recurrently hypoglycaemic diabetic (STZ+RH) and recurrently hypoglycaemic diabetic animals treated with 4.5 mg/kg carvedilol (STZ+RH+4.5 carvedilol). Data presented as mean ± SEM. *p < 0.05; ***p < 0.001