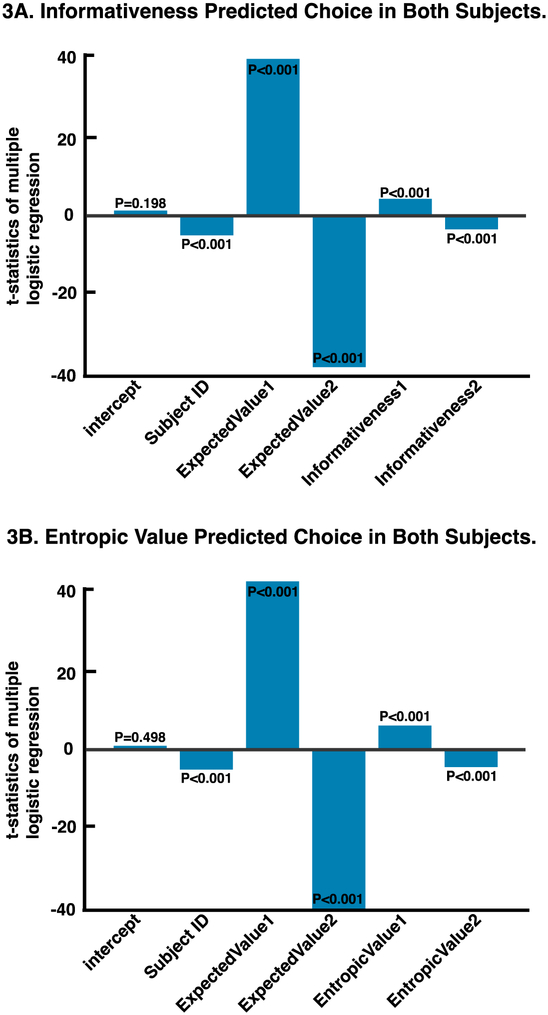
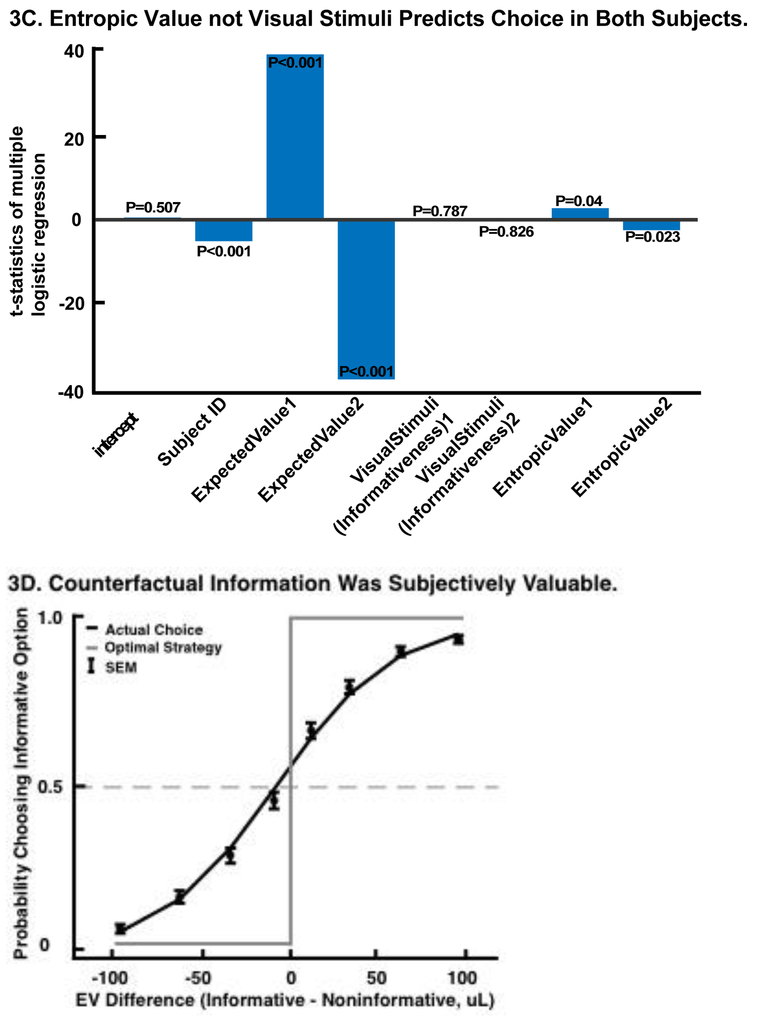
Figure 3.
(A-C) X-axis: predictors included in the multiple logistic regression. Y-axis: t- tstatistics of each predictor. Both informativeness and entropic value can explain choice behavior in addition to expected value. However, entropic value provides a significantly better fit. (A) Probability of choosing offer 1 as a function of the intercept, the expected values (EV) and the informativeness (info) of offer 1 and offer 2, fitted for both subjects. (B) Probability of choosing offer 1 as a function of the intercept, the expected values and the entropic value of offer 1 and offer 2, fitted for each subjects. (C) Probability of choosing offer 1 as a function of the intercept, the expected values, the visual stimuli (informativeness visual cues), and entropic value of offer 1 and offer 2. (D) Fitted logistic curve for probability of choosing informative option as a function of value difference (expected value of informative option minus expected value of non-informative option). The deviation from the curve of the optimal strategy and the left shift shows the higher subjective value placed on informative options.


