. 2021 Mar 30:M20-3936. doi: 10.7326/M20-3936

Figure 1. Spatial distribution and clusters of coronavirus disease 2019 testing, positivity, confirmed cases, and mortality and social vulnerability in ZIP code tabulation areas of Chicago.
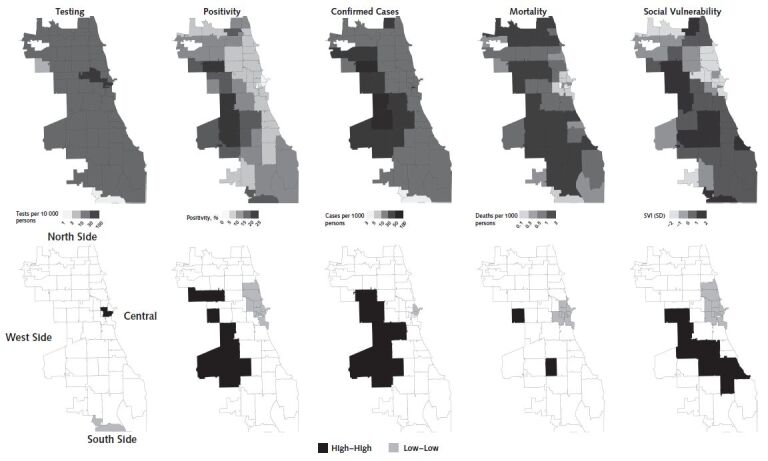
Figure 1. Spatial distribution and clusters of coronavirus disease 2019 testing, positivity, confirmed cases, and mortality and social vulnerability in ZIP code tabulation areas of Chicago. Clusters were calculated by using the local Moran I statistic; clusters have a P value < 0.05. “High–high” indicates hot spots and “low–low” indicates cold spots. SVI = Social Vulnerability Index.

Clusters were calculated by using the local Moran I statistic; clusters have a P value < 0.05. “High–high” indicates hot spots and “low–low” indicates cold spots. SVI = Social Vulnerability Index.