. 2021 Mar 30:M20-3936. doi: 10.7326/M20-3936

Figure 4. Scatter plots showing the relationship between the Social Vulnerability Index and coronavirus disease 2019 testing, positivity, confirmed cases, and mortality in ZIP code tabulation areas of Chicago, New York, and Philadelphia.
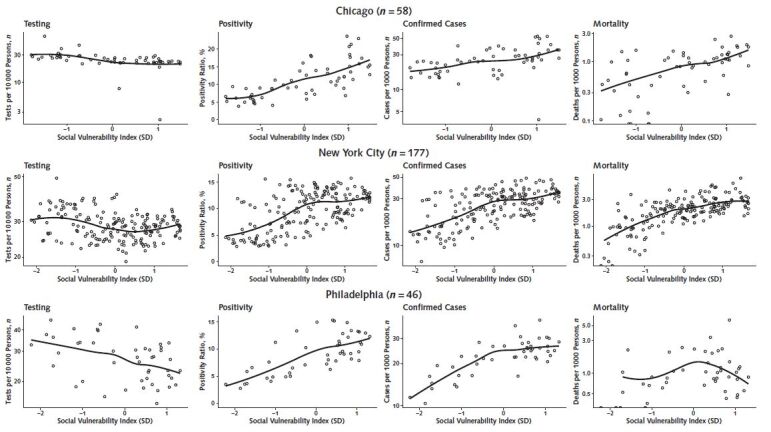
Figure 4. Scatter plots showing the relationship between the Social Vulnerability Index and coronavirus disease 2019 testing, positivity, confirmed cases, and mortality in ZIP code tabulation areas of Chicago, New York, and Philadelphia. Solid lines in graph are loess smoothers. The Social Vulnerability Index has been standardized for each city, so that its units are the SD of the Social Vulnerability Index for each city separately.

Solid lines in graph are loess smoothers. The Social Vulnerability Index has been standardized for each city, so that its units are the SD of the Social Vulnerability Index for each city separately.