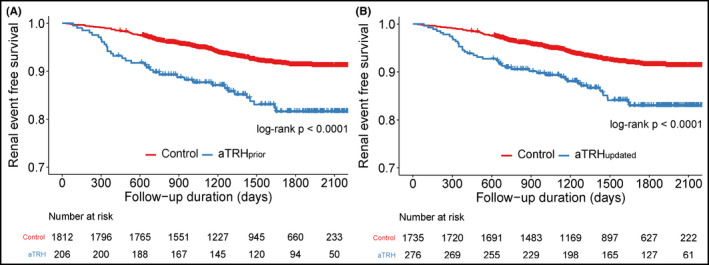
Figure 3.

Survival curves for major adverse cardiovascular event. Kaplan‐Meier survival curves for renal event according to resistant hypertension defined by the prior (A) and updated scientific statements (B). aTRH, apparent treatment‐resistant hypertension; MACE, major adverse cardiovascular event
