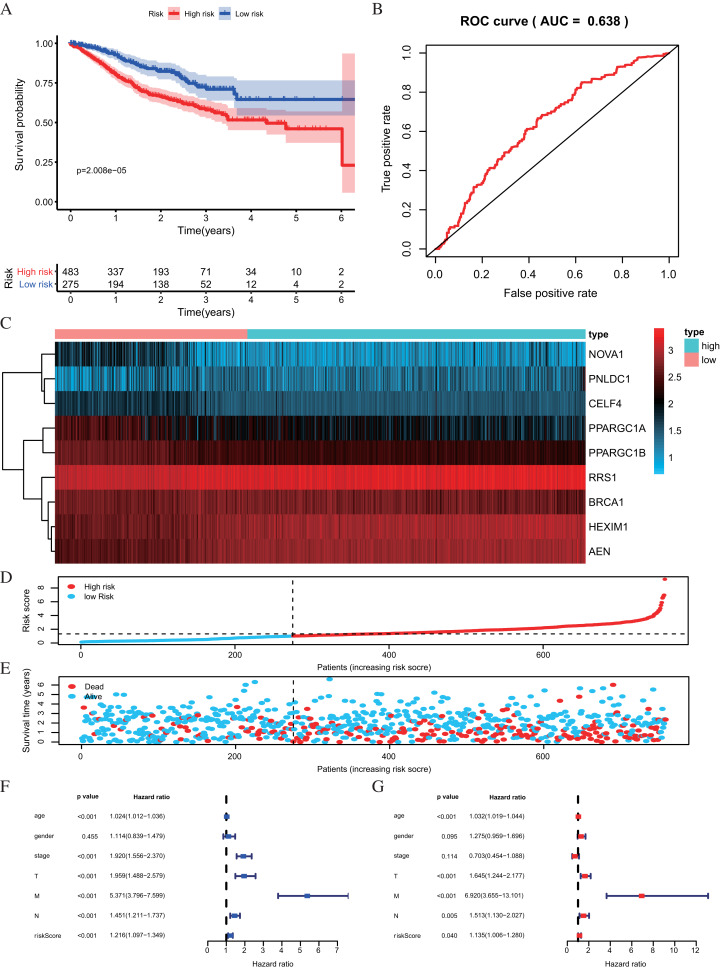
Figure 6. Risk score analysis of nine-RBPs prognostic model in the GEO cohort.
(A) Kaplan-Meier survival analysis of CRC patients for high and low risk subgroups. (B) ROC analysis of the specificity and sensitivity of the OS based on the risk score. (C) Heatmap of the RBPs expression profiles. (D and E) The distribution of patient’s survival time and survival status. The black dotted line is the optimum cutoff dividing patients into high risk and low risk groups. (F) Univariate independent prognosis Cox regression analysis. Forest plot of the relationship between risk factors and OS. (G) Multivariate independent prognosis Cox regression analysis. Forest plot of the association between risk factors and OS. ROC, Receiver Operating Characteristic, OS, Overall survival.

