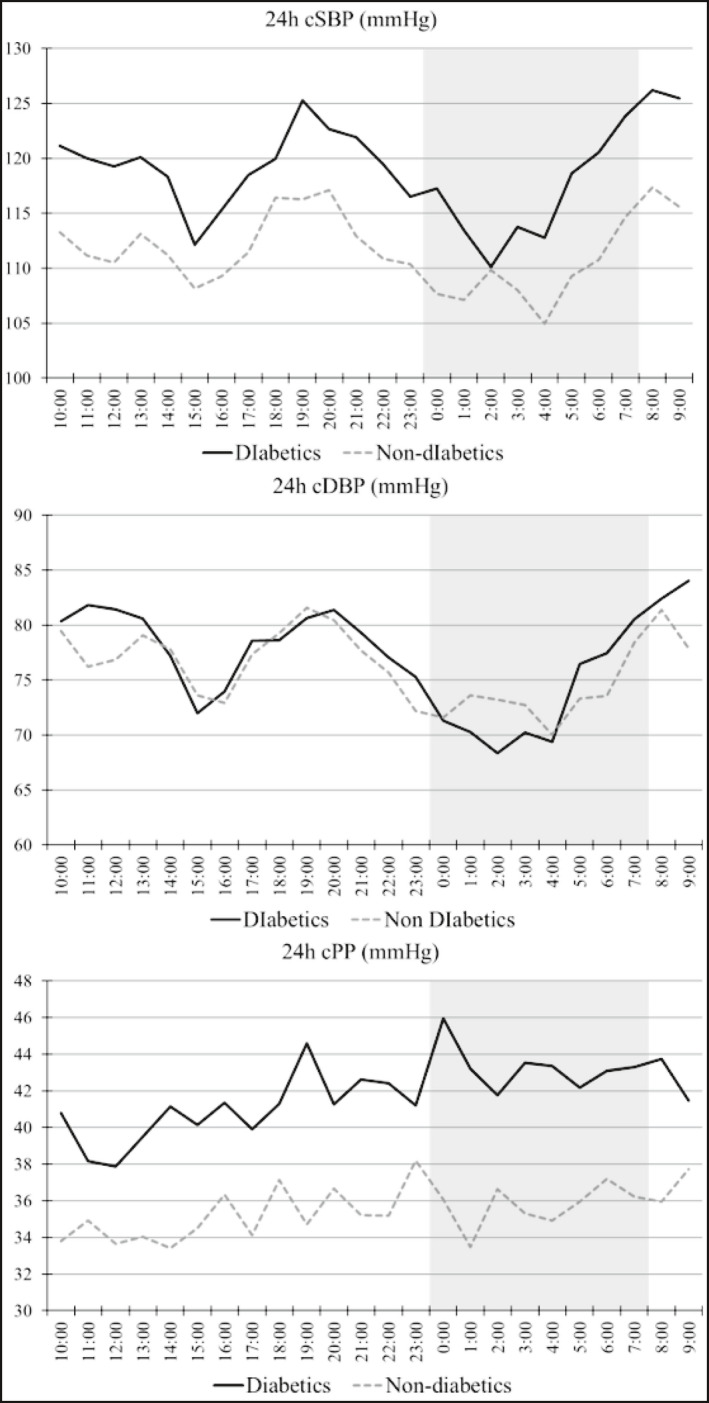
Figure 1.

Trajectories of (A) central SBP, (B) central DBP, and (C) central pulse pressure in patients with and without diabetes. Graph presents averaged values averaged between 10:00 am of the Day 1 and 09:00 am the Day 2. The grayed zone indicates the nighttime period
