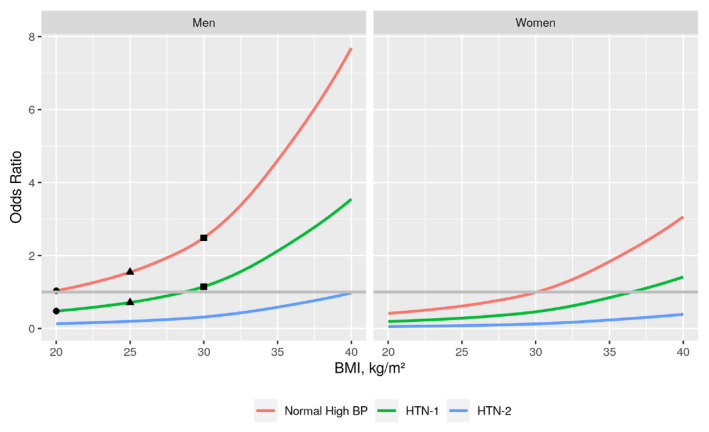
Figure 2.

Charts represent average risk (%) of each hypertension stage (defined by ESC/ESH guidelines)4 in a person of 35 years old according to BMI. The reference is the probability of having normal‐high BP with BMI = 20 kg/m2 (circle in red line). At this BMI, the probability of having HTN 1 reduces in about 50% (dot in green line), and HTN 2 reduces over 90% (blue line). When the BMI increases, the probability of being in each stage also increases. If the BMI increases to 25 kg/m2 (overweight), the probability of having normal‐high BP increases about 70% (triangle in red line); whereas the probability of having HTN 1 increases about 30% (triangle in green line) compared with a BMI of 20 kg/m2 (circle in red line and green line). Finally, if the BMI increases to 30 kg/m2 (obesity), the probability of normal‐high BP increases by about 2.5‐fold (square in red line) and the probability of HTN 1 by about 60% (square in green line) when compared with a BMI of 20 kg/m2. As defined by ESC/ESH, high‐normal BP is 130‐139 mmHg and/or 85‐89 mmHg, HTN‐1 is 140‐159 mmHg and/or 90‐99 mmHg, and HTN‐2 is 160‐179 mmHg and/or 100‐109 mmHg. Abbreviations: BMI, body mass index; BP, blood pressure; ESC, European Society of Cardiology; ESH, European Society of Hypertension; HTN‐1 = hypertension stage 1; HTN‐2 = hypertension stage 2
