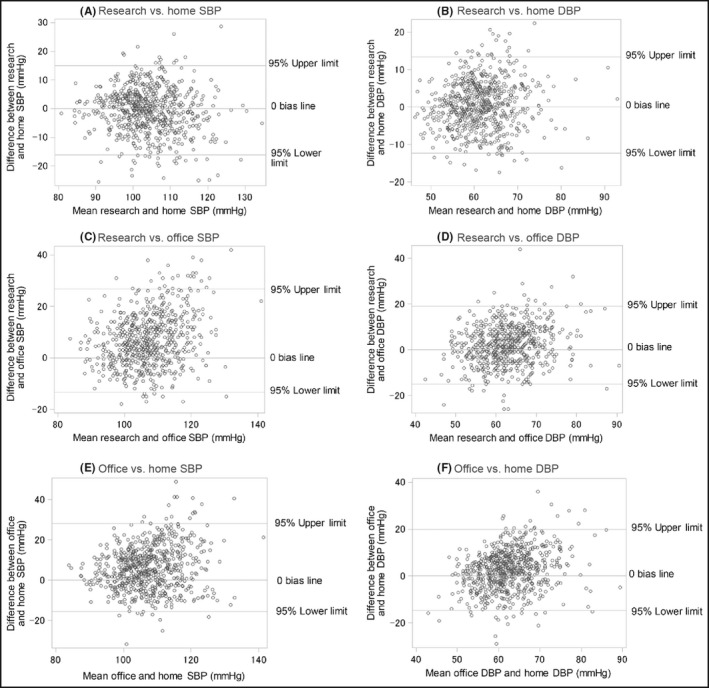
Figure 2.

Bland‐Altman plots. (A) research vs. home SBP, (B) research vs. home DBP, (C) research vs. office SBP, (D) research vs. office DBP, (E) office vs. home SBP, and (F) office vs. home DBP. Horizontal axes, means of paired BP; vertical axes, difference in BP (r, Pearson correlation coefficient; P, p‐value). DBP, diastolic blood pressure; SBP, systolic blood pressure
