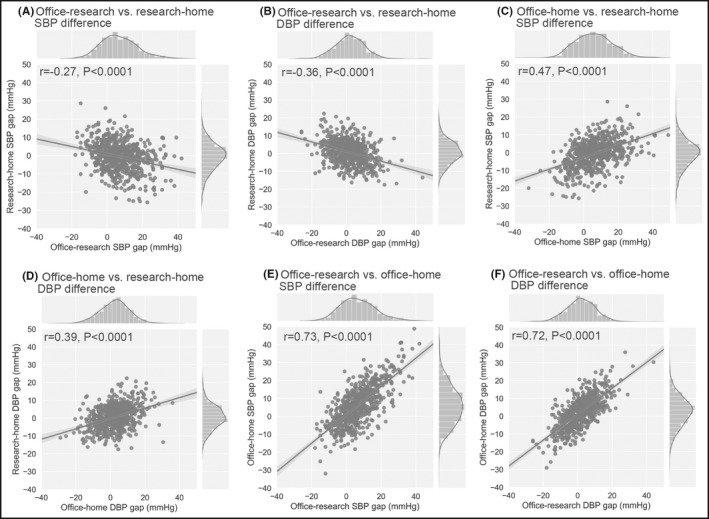
Figure 3.

Scatter plots, histograms and regression lines of BP differences. (A) office‐research vs. research‐home SBP difference, (B) office‐research vs. research‐home DBP difference, (C) office‐research vs. office‐home SBP difference, (D) office‐research vs. office‐home DBP difference, (E) office‐home vs. research‐home SBP difference, and (F) office‐home vs. research‐home DBP difference. Lines in histograms represent estimated kernel density for BP difference distribution. Gray area represents standard error (r, Pearson correlation coefficient; P, P‐value). DBP, diastolic blood pressure; SBP, systolic blood pressure
