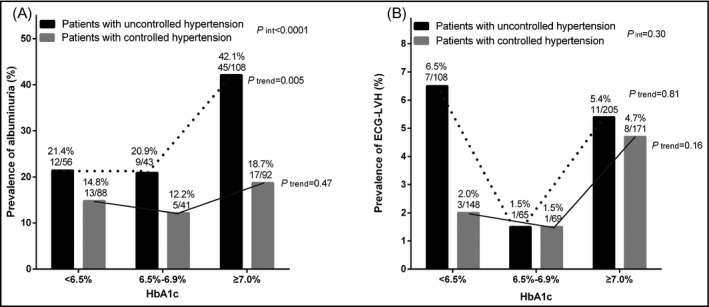
Figure 2.

Prevalence of albuminuria (A) and ECG‐left ventricular hypertrophy (B) according to the less tight and tight control status of diabetes in patients with hypertension controlled (open bar) and uncontrolled (solid bar). The P value for interaction between the control status of diabetes mellitus and hypertension in relation to the prevalence of albuminuria and left ventricular hypertrophy, and the P values for trend and the number of patients are given
