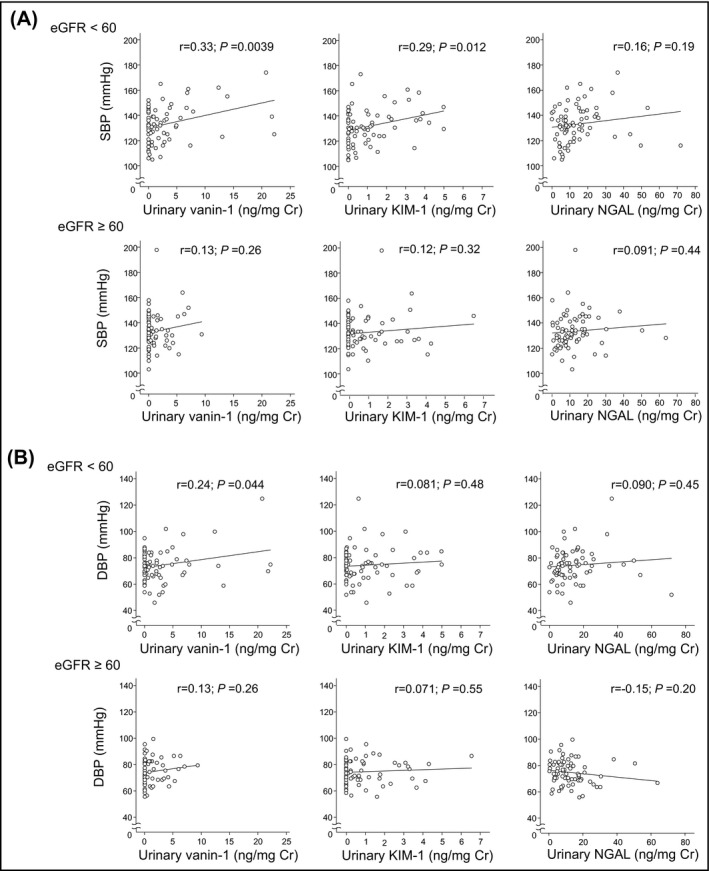
FIGURE 2.

Scatterplot illustrating the relationship of SBP (A) and DBP (B) with urinary vanin‐1, KIM‐1, and NGAL, stratified with eGFR value (<60 mL/min per 1.73 m2; ≥60 mL/min per 1.73 m2). Cr, creatinine; DBP, diastolic blood pressure; eGFR, estimated glomerular filtration rate; KIM‐1, kidney injury molecule‐1; NGAL, neutrophil gelatinase‐associated lipocalin; SBP, systolic blood pressure
