Figure 3.

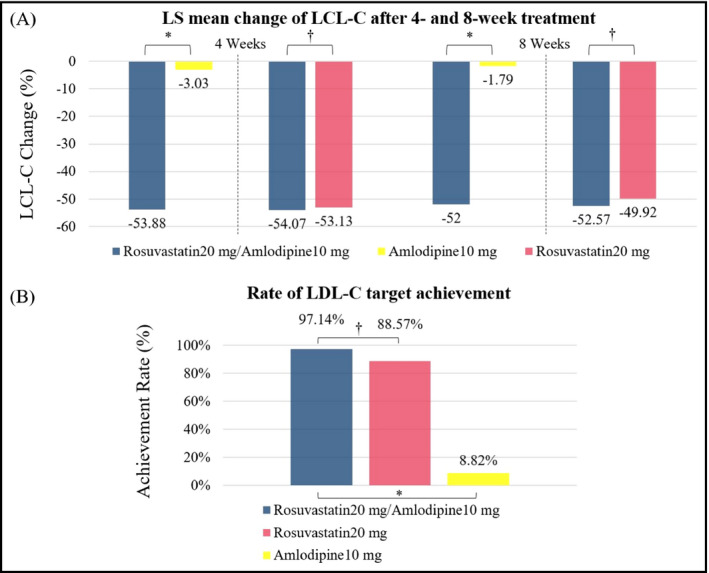
Comparison of changes in low‐density lipoprotein cholesterol (LDL‐C) after treatment. A, Least‐squares mean percent change from baseline in LDL‐C. B, Rate of target goal achievement. *P‐value < .0001, † P‐value > .05

Comparison of changes in low‐density lipoprotein cholesterol (LDL‐C) after treatment. A, Least‐squares mean percent change from baseline in LDL‐C. B, Rate of target goal achievement. *P‐value < .0001, † P‐value > .05