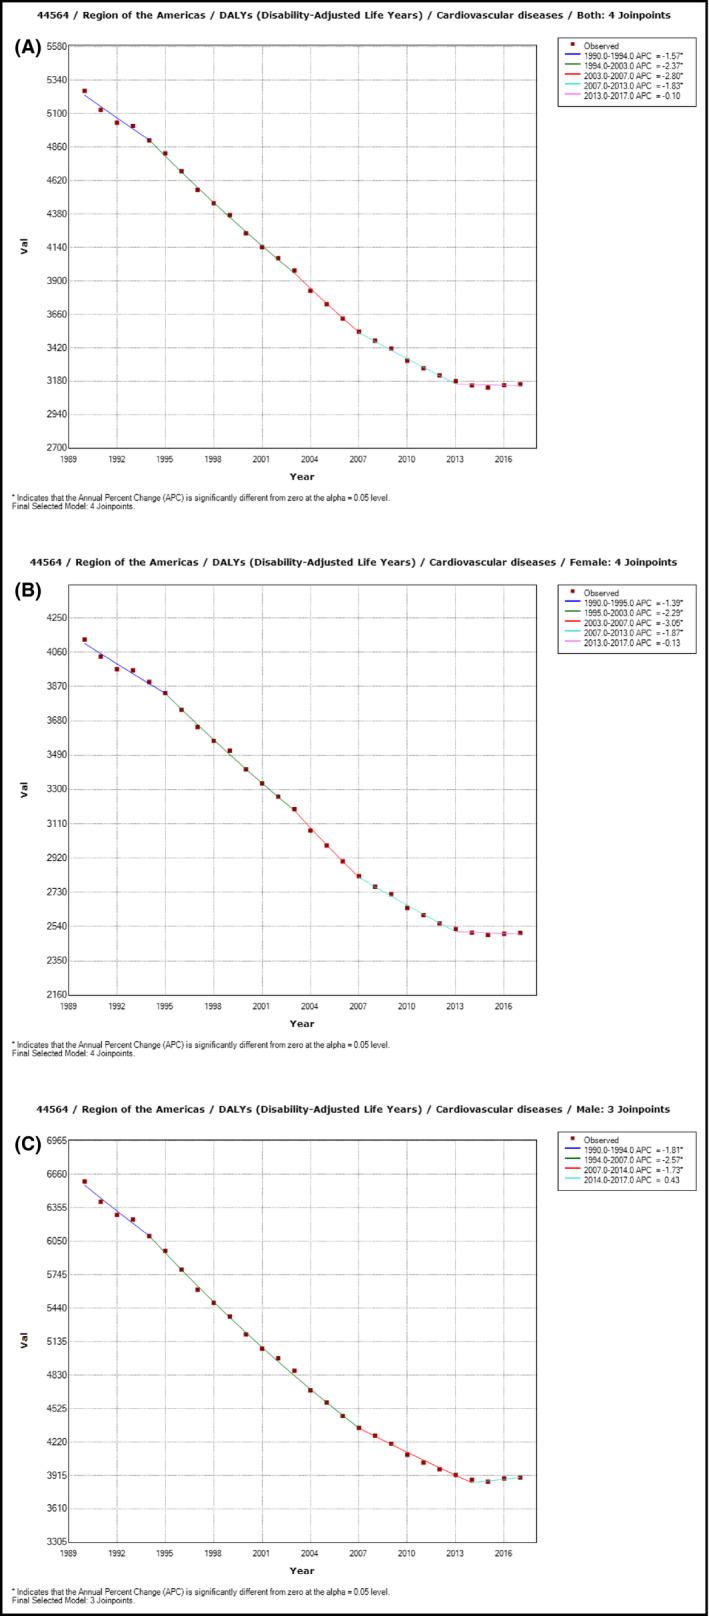
Figure 1.

Trends in age‐standardized rates of cardiovascular disease disability‐adjusted life years per 100 000 populations by sex in the Region of the Americas, 1990‐2017. A: Both sexes combined. B: Female. C: Male. Dots represent estimates of the age‐standardized Cardiovascular diseases DALYs rate per 100 000 population, and the lines represent time series trend segments which slope, summarized by the annual percentage change (APC), are statistically different
