Figure 4.

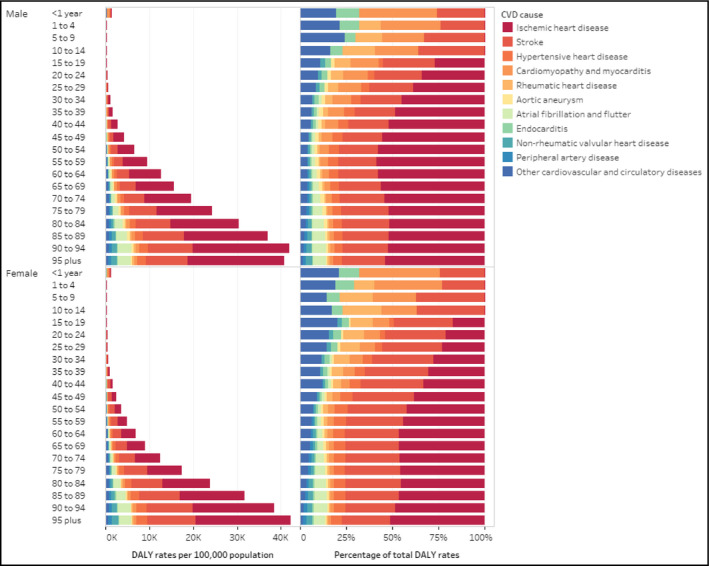
Age‐standardized rates and percentage of disability‐adjusted life years per 100 000 population for cardiovascular disease causes by age and sex in the Region of the Americas, 2017

Age‐standardized rates and percentage of disability‐adjusted life years per 100 000 population for cardiovascular disease causes by age and sex in the Region of the Americas, 2017