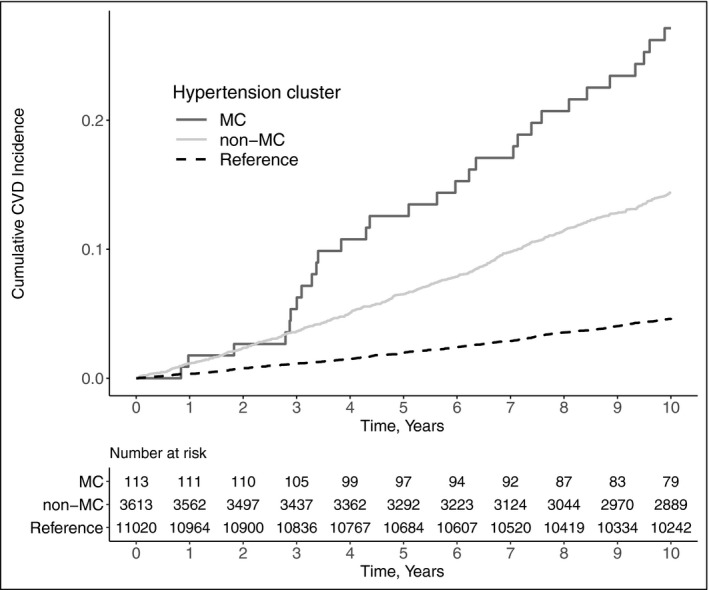
FIGURE 3.

Kaplan‐Meier plot for cumulative CVD incidence plotted against time in years. P value for the difference in survival between clusters was <.0001 (log‐rank test). The study sample consisted of 3726 individuals with grade 2 hypertension and 11 020 reference individuals from FINRISK 1997, 2002, and 2007 cohorts. CVD, cardiovascular disease; MC, the metabolically challenged cluster with higher blood glucose and body‐mass index; non‐MC, the non‐metabolically challenged cluster with lower blood glucose and body‐mass index
