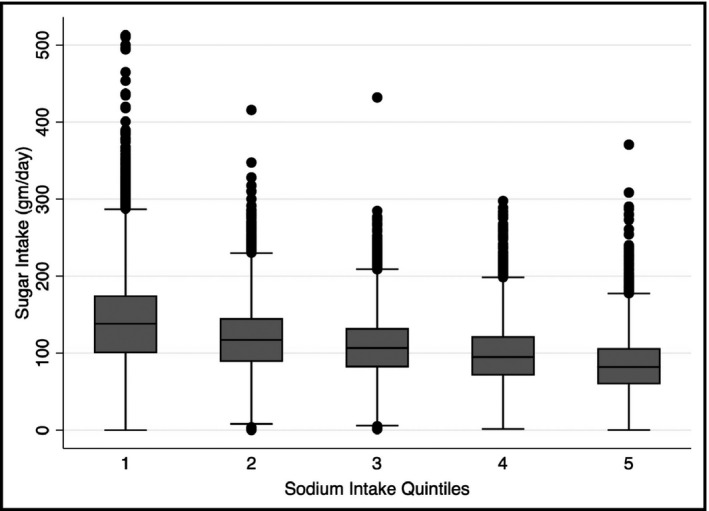
Figure 2.

Boxplot showing the association between quantiles of sodium intake and reported 24‐h sugar intake. Sugar intake was significantly higher in SQ1 (141.2 g/d) and SQ2 (118.6 g/d) and significantly lower in SQ4 (97.9 g/d) and SQ5 (85.6 g/d) compared to the average sodium intake of SQ3 (108.6 g/d; all P < .01)
