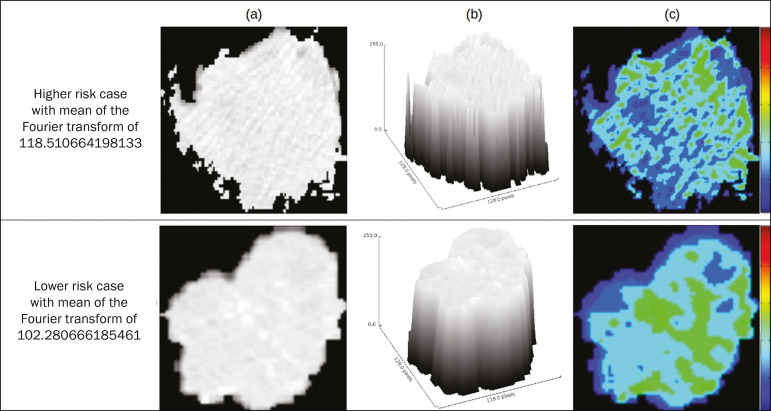
Figure 4.
Quantification of tumor heterogeneity in the lesions, stratified by the mean of the Fourier transform. a: Axial CT image, with lung window settings, showing the segmented tumor. b: Three-dimensional distribution of the gray levels. c: Map reflecting the local energy of the tumor with a 5 × 5 pixel window.

