Figure 2.
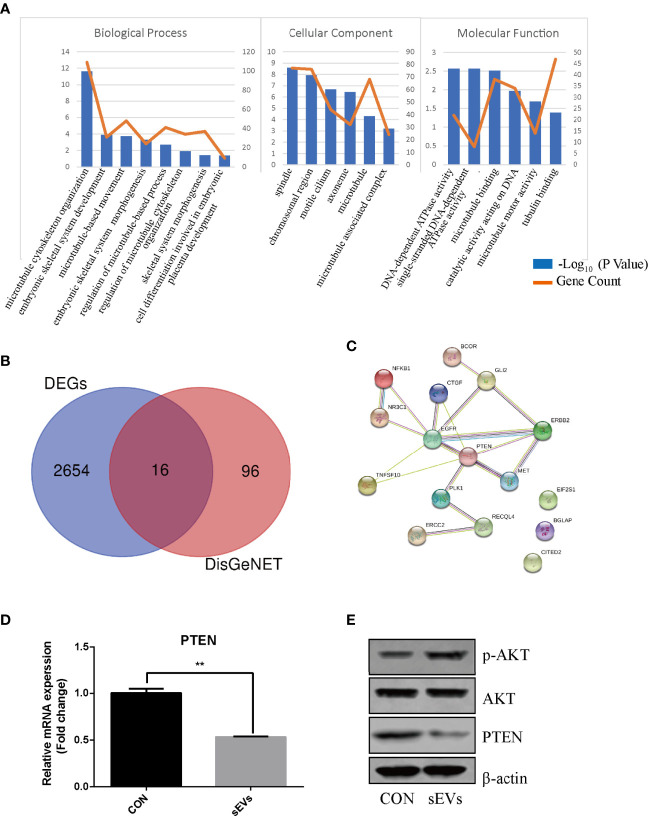
PTEN and miR-19a-3p are involved in OS. (A) GO enrichment analysis of DEGs in expression dataset of OS (GSE87624). The representative terms in BP, CC and MF were listed. X-axis represents the GO term. The left Y-axis represents the -Log10 (P Value) and the right Y-axis represents the count of genes. (B) The intersection of DEGs and the genes related to OS. The data DEGs was obtained from GSE87624 and the genes related to OS were from DisGeNET. (C) Interaction network among predicted OS-related DEGs. (D) QRT-PCR analysis of PTEN expression. (E) Western Blot analysis of the effects sEVs on p-AKT, AKT and PTEN expression. (D, E) were performed with RAW264.7 cells stimulated with RANKL in the absence or presence of K7M2 cells’ sEVs for 4 days. Values are mean ± SEM of three independent experiments. **P < 0.01.

