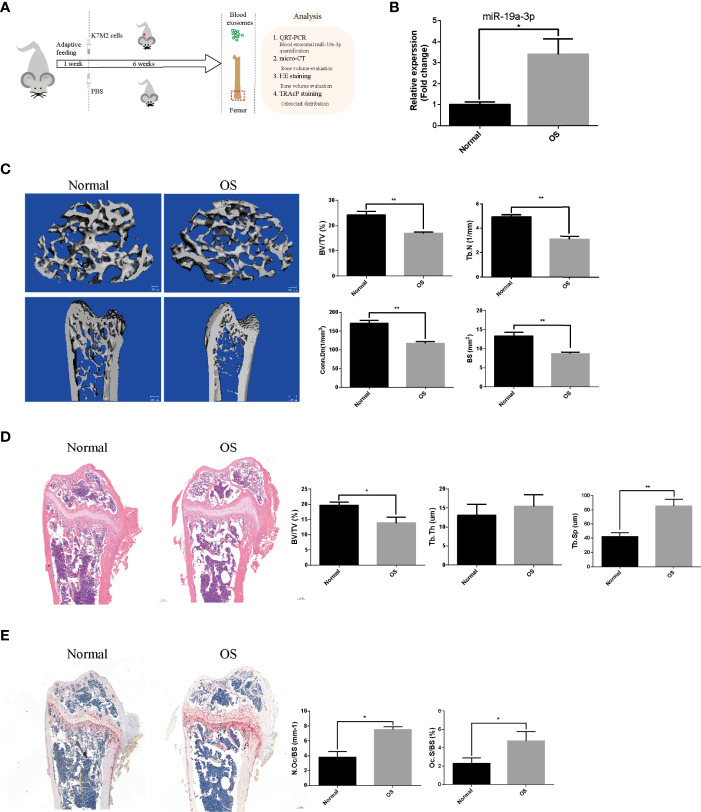
Figure 6.
The sEVs’ miR-19a-3p from OS mice results in bone osteopenia in vivo. The mice were randomly divided into two groups (N=5 per group): Normal group and OS group. (A) Schematic illustration of the establishment of OS model and the experimental design. (B) Representative qRT-PCR analysis of the blood level of sEVs’ miR-19a-3p in normal and OS mice. (C) Representative micro-CT images showing the bone loss in OS femur and the analysis of parameters regarding bone microstructure, including bone volume per tissue volume (BV/TV), trabecular number (Tb. N), connectivity density (Conn. Dn), and bone surface (BS). (D) Representative images of HE staining of decalcified bone sections and quantitative analyses of BV/TV, Tb. Th and Tb. Sp in tissue sections. (E) Representative images of TRAP staining of decalcified bone sections and quantitative analyses of N.Oc/BS and Oc.S/BS in tissue sections. Values are mean ± SEM from five mice data per group. *P < 0.05, **P < 0.01.

