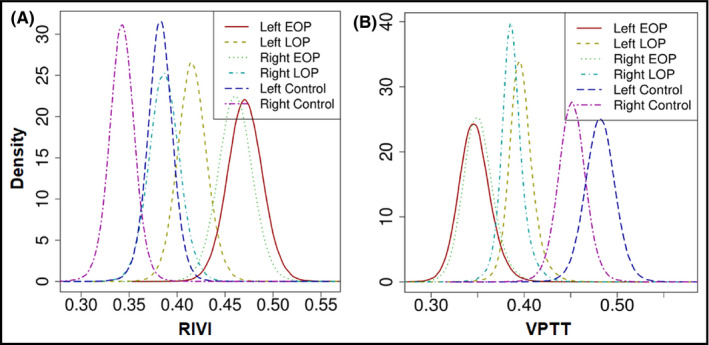
FIGURE 3.

Density plots depicting the posterior densities for estimates of renal interlobar vein impedance and venous pulse transit time in the different subgroups. EOP, early‐onset preeclampsia; LOP, late‐onset preeclampsia; RIVI, renal interlobar vein impedance; VPTT, venous pulse transit time
