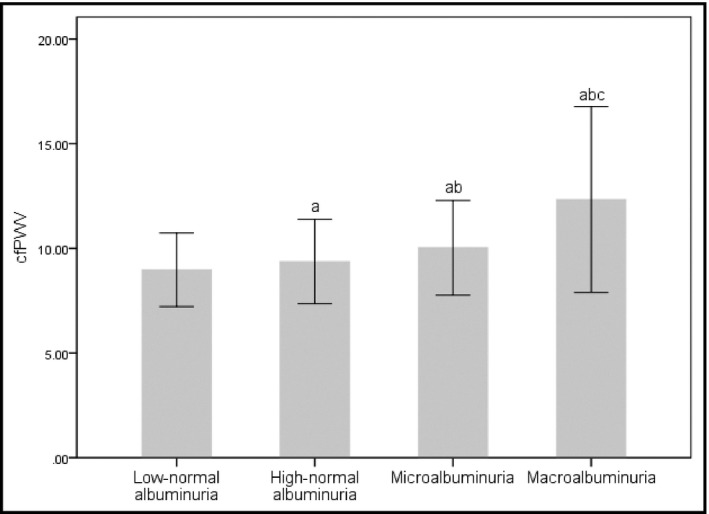
FIGURE 2.

The comparison of carotid‐femoral pulse wave velocity (cfPWV) among subjects with different urinary albumin‐to‐creatinine ratio (UACR) groups. cfPWV increased progressively with the increase of UACR. a p < .05 vs low‐normal albuminuria, b p < .05 vs high‐normal albuminuria, c p < .05 vs microalbuminuria
