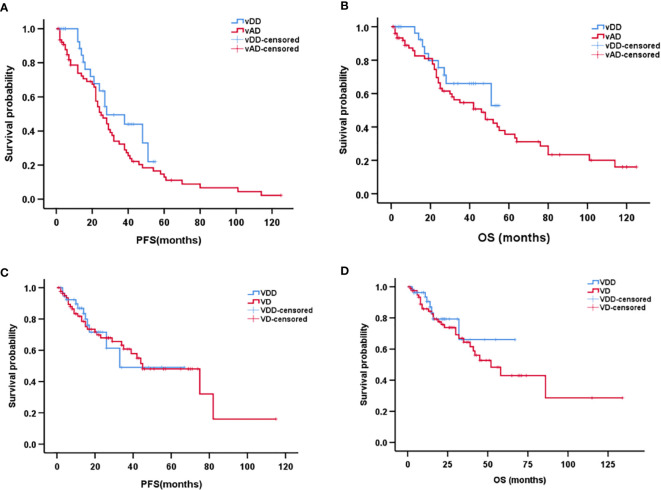
Figure 2.
Kaplan–Meier curve of progression-free survival (A) and overall survival (B) between vDD and vAD in patients with newly diagnosed multiple myeloma. Kaplan–Meier curve of progression-free survival (C) and overall survival (D) between VDD and VD in patients with newly diagnosed multiple myeloma.

