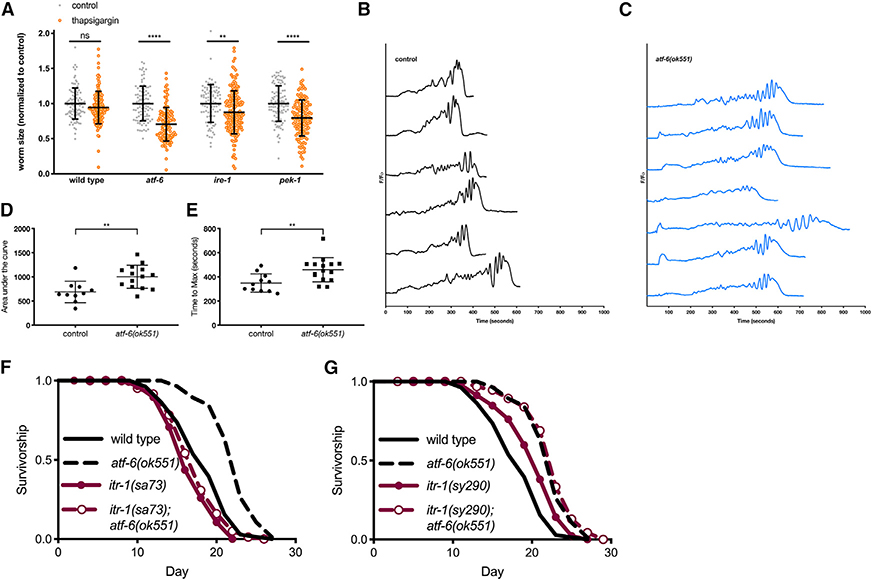
Figure 3. ER Calcium Flux Functions Downstream of atf-6 in Regulating Lifespan.
(A) Relative growth of L1 larval worms exposed to 5 mg/mL of the SERCA inhibitor thapsigargin for 48 h (means ± SDs of n = 88–164 worms combined over 2 independent trials).
(B and C) Representative traces of GCaMP3 imaging in the spermatheca of worms beginning with oocyte entry and ending with spermathecal contraction.
(D and E) Area under the curve (AUC) (D) and time-to-maximum (E) summary measurements of the GCaMP3 calcium traces recorded in the spermatheca of wild-type and atf-6 mutant worms (means ± SDs of 11–16 animals combined over 2 repeats).
(F) Lifespan analysis of atf-6 mutants in the temperature-sensitive IP3R/itr-1(sa73) background at the semi-permissive temperature of 20°C (n = 100 per condition).
(G) Lifespan analysis of the atf-6 interaction with itr-1(sy290) gain-of-function mutation (n = 100 per condition). NS = p > 0.05, **p < 0.01, ***p < 0.001, and ****p < 0.0001 by t test.

