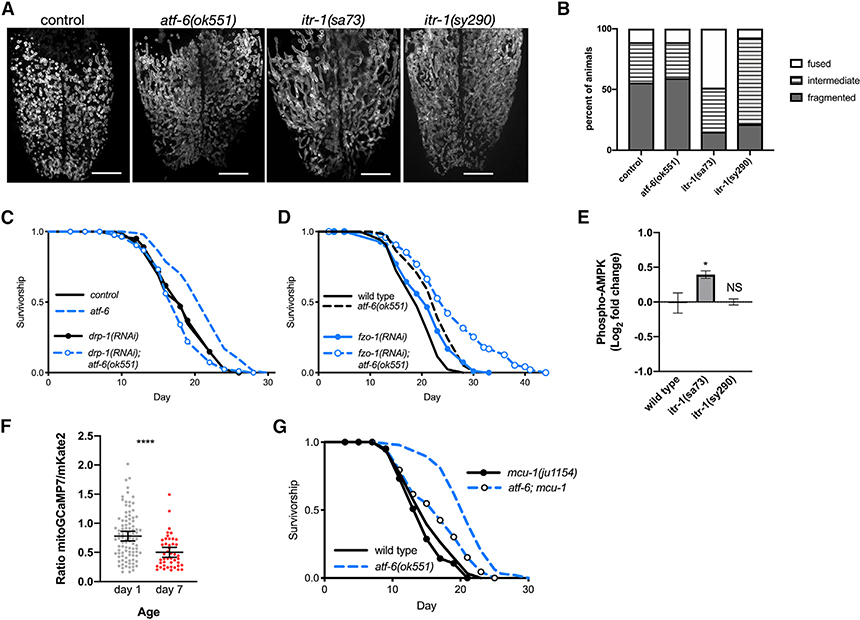
Figure 4. ER-Mitochondrial Communication via Calcium Regulates Lifespan.
(A) Representative fluorescence z stack projections of intestinal mitochondrial networks via TOMM-20(1–49)::EGFP in day 1 adult animals. Scale bars: 10 μm.
(B) Quantification of mitochondrial morphology (n = 14–27 worms combined over 2 trials; p < 0.0001 comparing control versus itr-1(sa73) and p = 0.001 comparing control versus itr-1(sy290)).
(C and D) Lifespan analysis of worms fed dsRNA for the mitochondrial fission (drp-1, C) and fusion (fzo-1, D) machineries in control and atf-6 mutant animals (n = 100 per condition).
(E) Quantification of western blots for P-AMPK normalized to wild-type animals (means ± SDs of n = 3 independent experiments using lysate from ~600 young adult worms; *p = 0.024 by ANOVA).
(F) Quantification of the ratio of GCaMP7:mKate2 fluorescence as an indicator of mitochondrial calcium content (means ± SDs of n = 96 and 45 combined from 3 independent repeats; p < 0.0001 by t test).
(G) Lifespan analysis of atf-6 mutants harboring a deletion in mcu-1 to ablate acute mitochondrial calcium uptake (n = 100 per condition).

