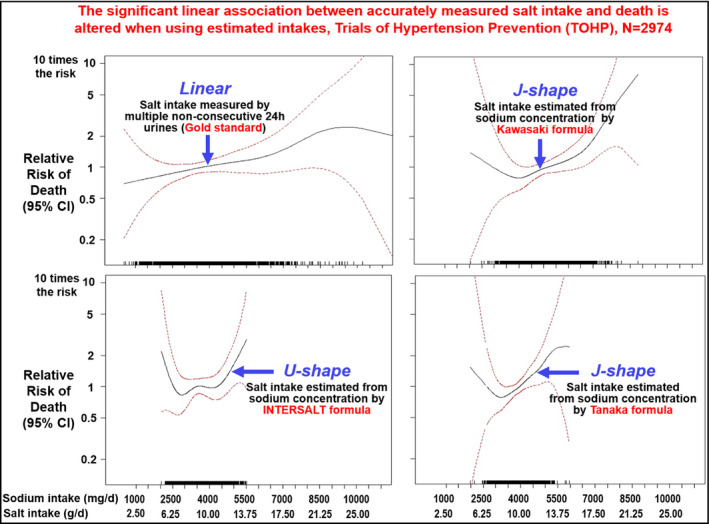
Figure 1.

Relationship between average estimates of 24‐h urinary sodium excretion and all‐cause mortality adjusted for age, sex, race/ethnicity, clinic, treatment assignment, education status, baseline weight, alcohol use, smoking, exercise, and family history of cardiovascular disease. Rug plot indicates distribution of sodium excretion (adapted from He et al, Hypertension 2019).21
