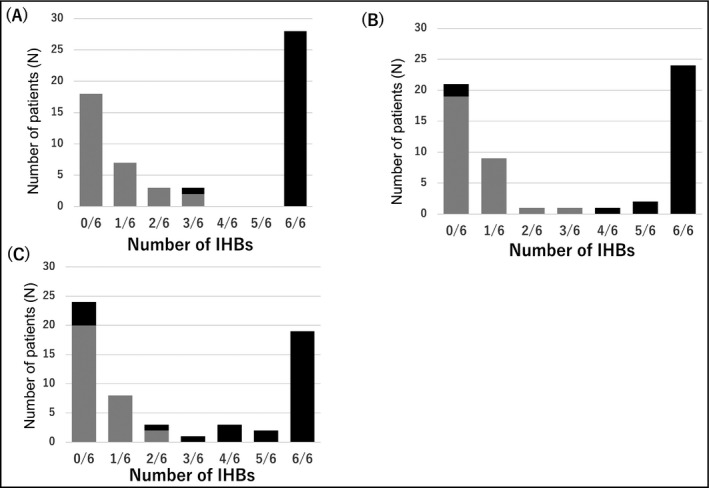
Figure 4.

The distribution of sinus rhythm and atrial fibrillation according to the number of IHBs of three measurements. A, IPP 15%, B, IPP 20%, C, IPP 25%. Black bars = patients with atrial fibrillation; gray bars = sinus rhythm patients. IHB, irregular heartbeat; IPP, irregular pulse peak
