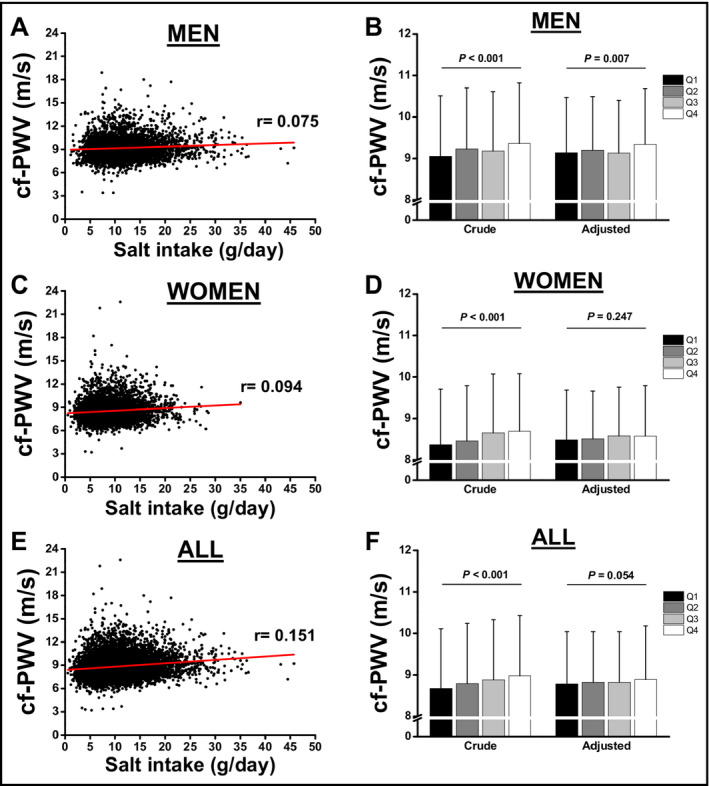
Figure 2.

Pearson correlation analysis between salt intake and cf‐PWV in men (A) and women (C). All participants are represented at panel E and F. Analysis of covariance for the association between cf‐PWV according to quartiles (Q) of salt intake in men (B) and women (D). Association was adjusted for age, SBP, BMI, eGFR, fasting glucose, uric acid, albuminuria, and K+ excretion
