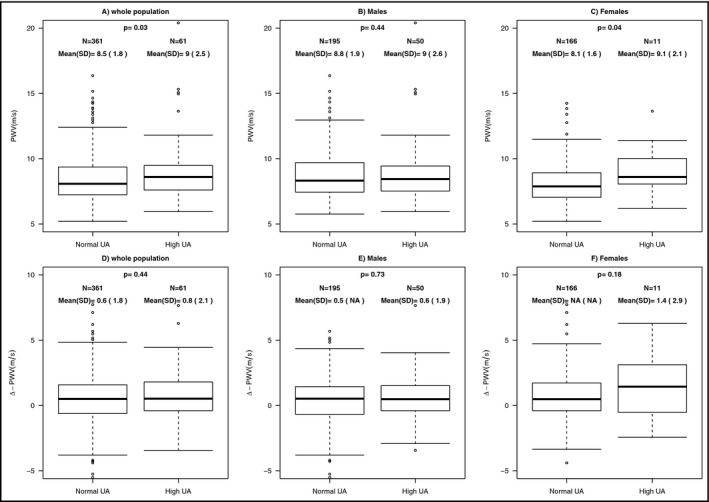
Figure 1.

PWV and ΔPWV in normouricemic vs hyperuricemic patients in the whole population (panel A and D) and divided according to sex (panel B and E for males and panel C and F for females). PWV, pulse wave velocity; UA, uric acid. Vertical lines show 5th and 95th percentiles, boxes show 25th and 75th percentiles, and horizontal lines show 50th percentile
