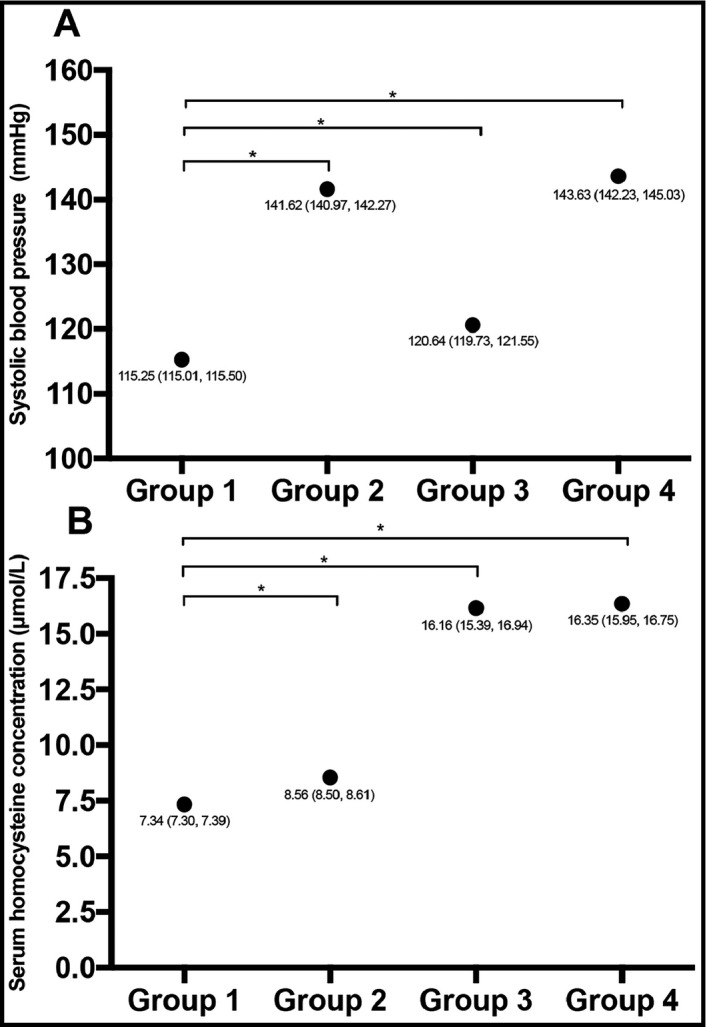
Figure 1.

Blood pressure level and serum homocysteine concentration according to the presence or absence of reduced eGFR and albuminuria. Subjects were divided into four groups: Group 1: normal eGFR and non‐albuminuria; Group 2: reduced eGFR and non‐albuminuria; Group 3: normal eGFR and albuminuria; Group 4: reduced eGFR and albuminuria. Each point indicates the mean value of the corresponding group, and the legend beside the point shows the mean value and its 95% confidence interval. The figure suggests that the presence of reduced eGFR and albuminuria is associated with increased SBP level and serum homocysteine concentration. In Group 3, patients still have significantly increased SBP level and homocysteine concentration when eGFR is normal. The line indicated the comparison between the connected two groups. *P for comparison <.001. eGFR, estimated glomerular filtration ratio; SBP, systolic blood pressure
