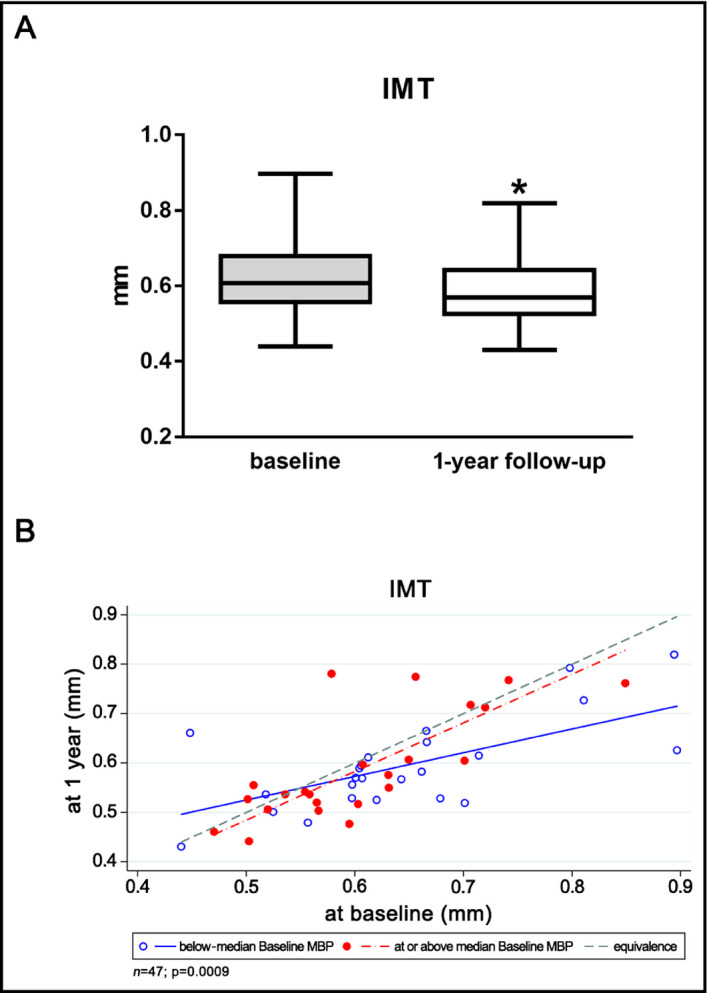
Figure 1.

(A) IMT at baseline and after one year of antihypertensive therapy (B) IMT at the 1‐y follow‐up as a function of baseline IMT in subjects grouped by baseline MBP. Fitted regression lines below and above median represent subjects at 25th and 75th percentile, respectively, of baseline MBP. IMT, intima‐media thickness; MBP, mean blood pressure. *P = 0.0003
